PT Adi Sarana Armada Tbk's management explains the business in its own materials. The slides below do the most of that work, pulled from the documents preserved in Sources. Each source link opens the complete presentation at that slide in a new tab.
ASSA's own overview deck: the fullest current walk through the three pillars, financials, ESG and 2024 targets. · Open the full document →
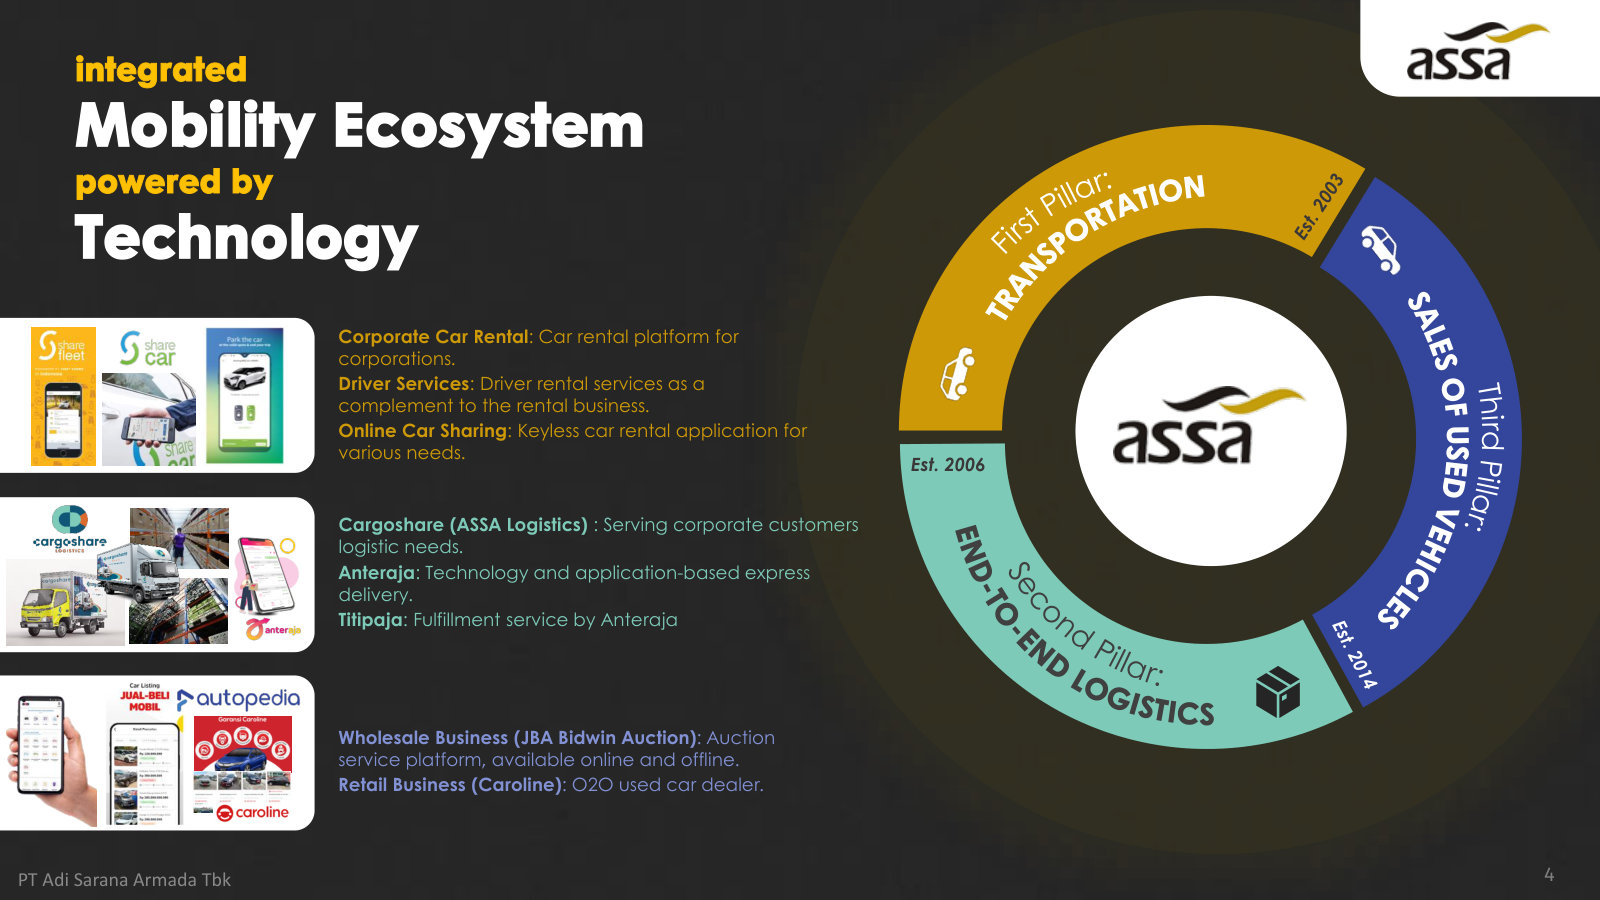
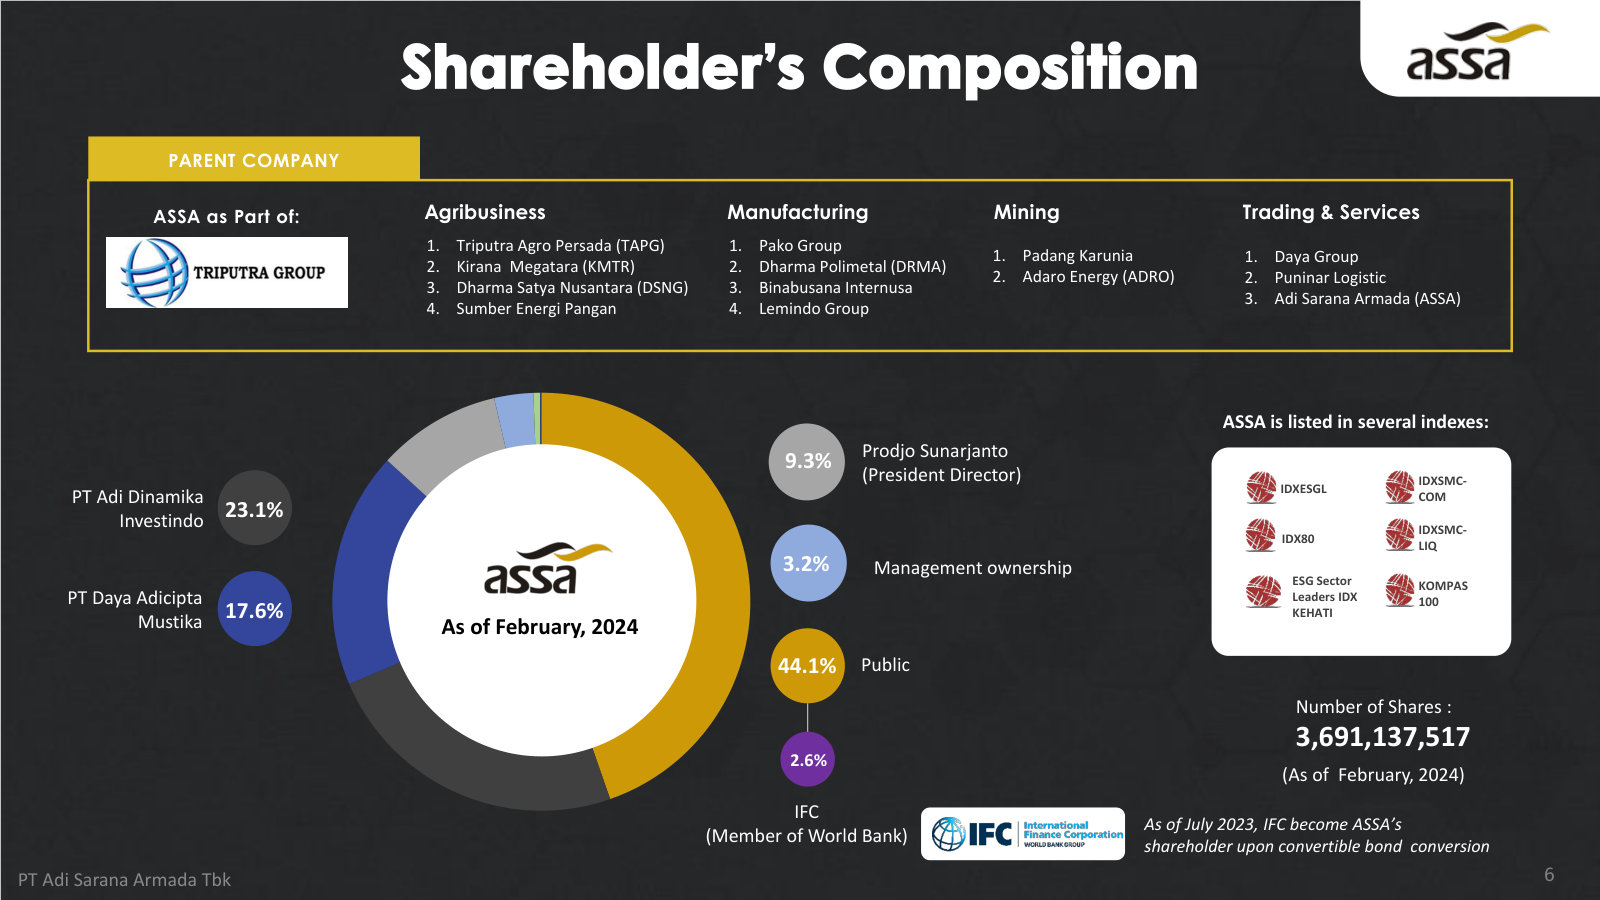
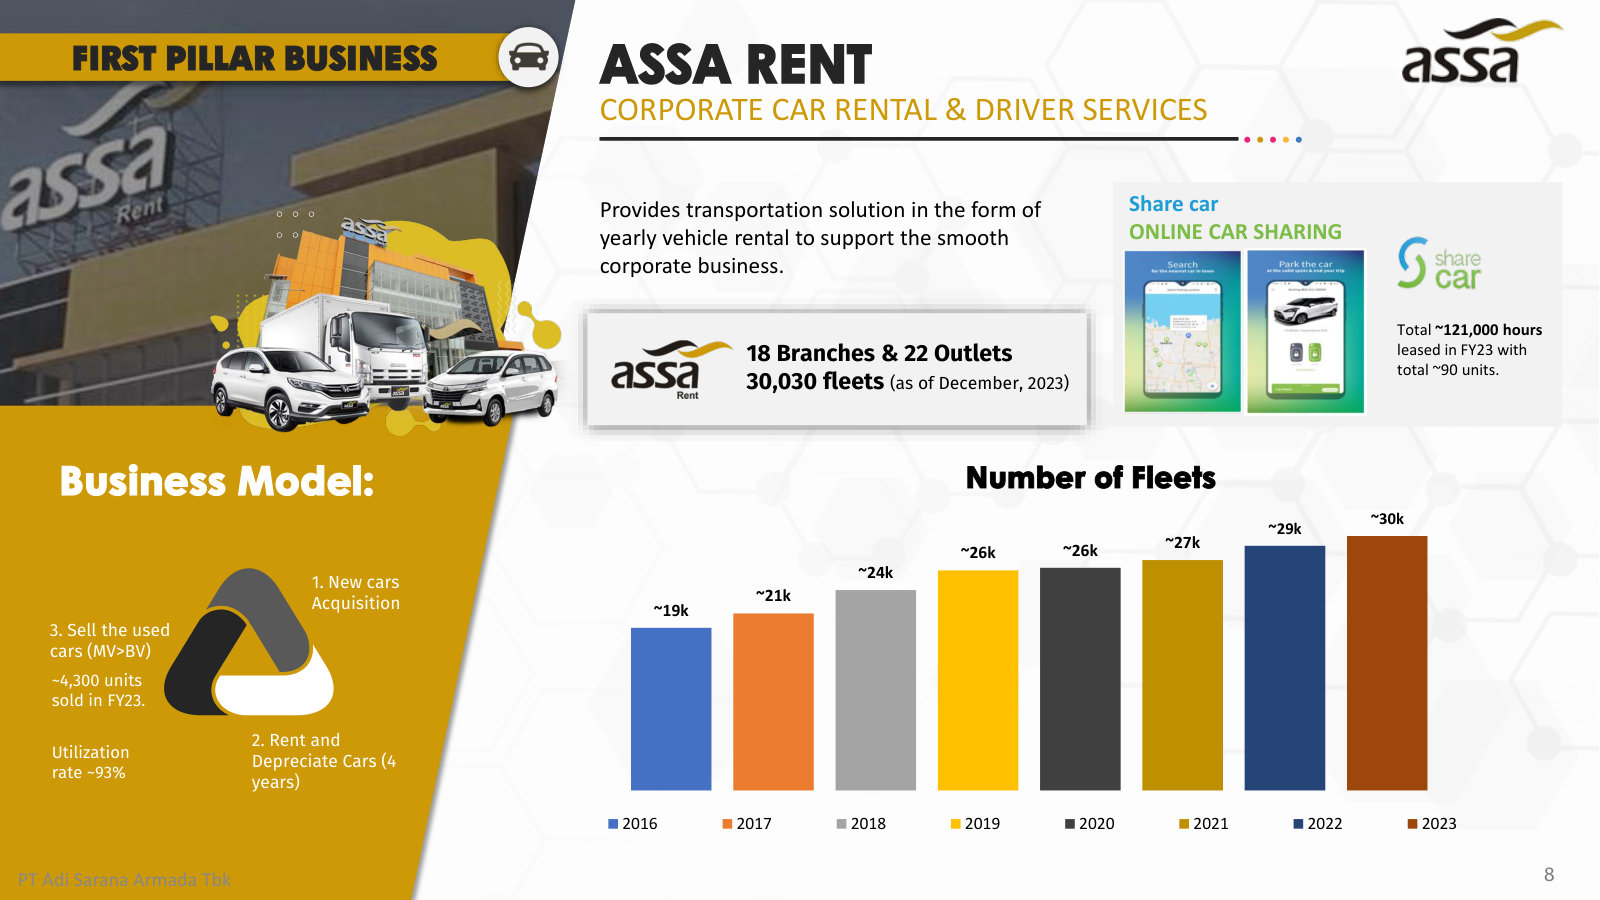
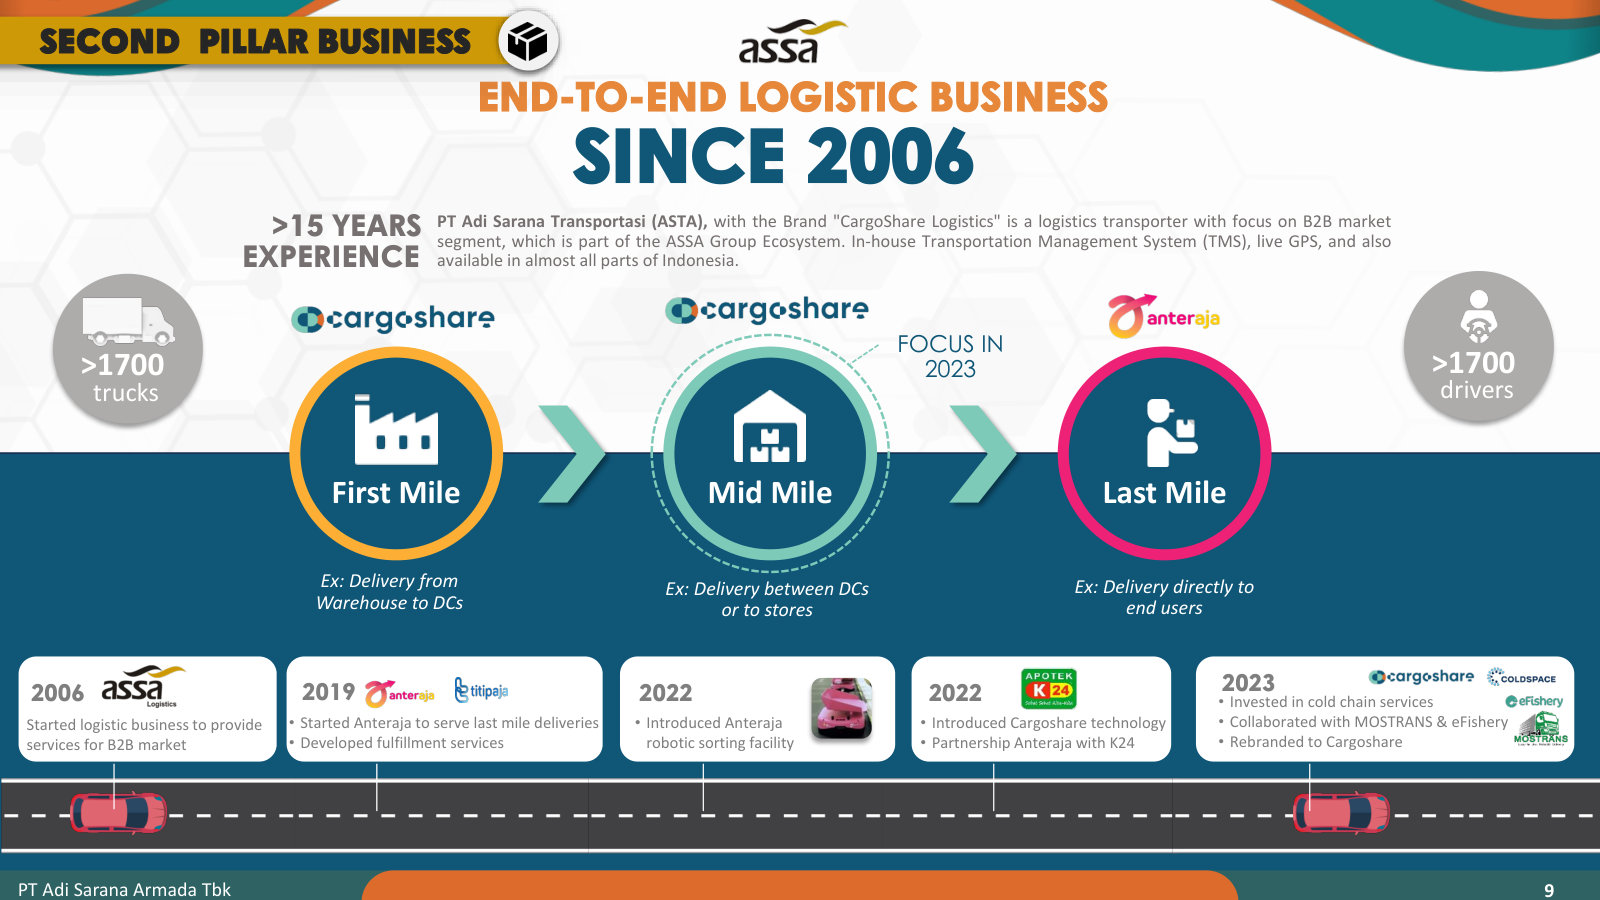
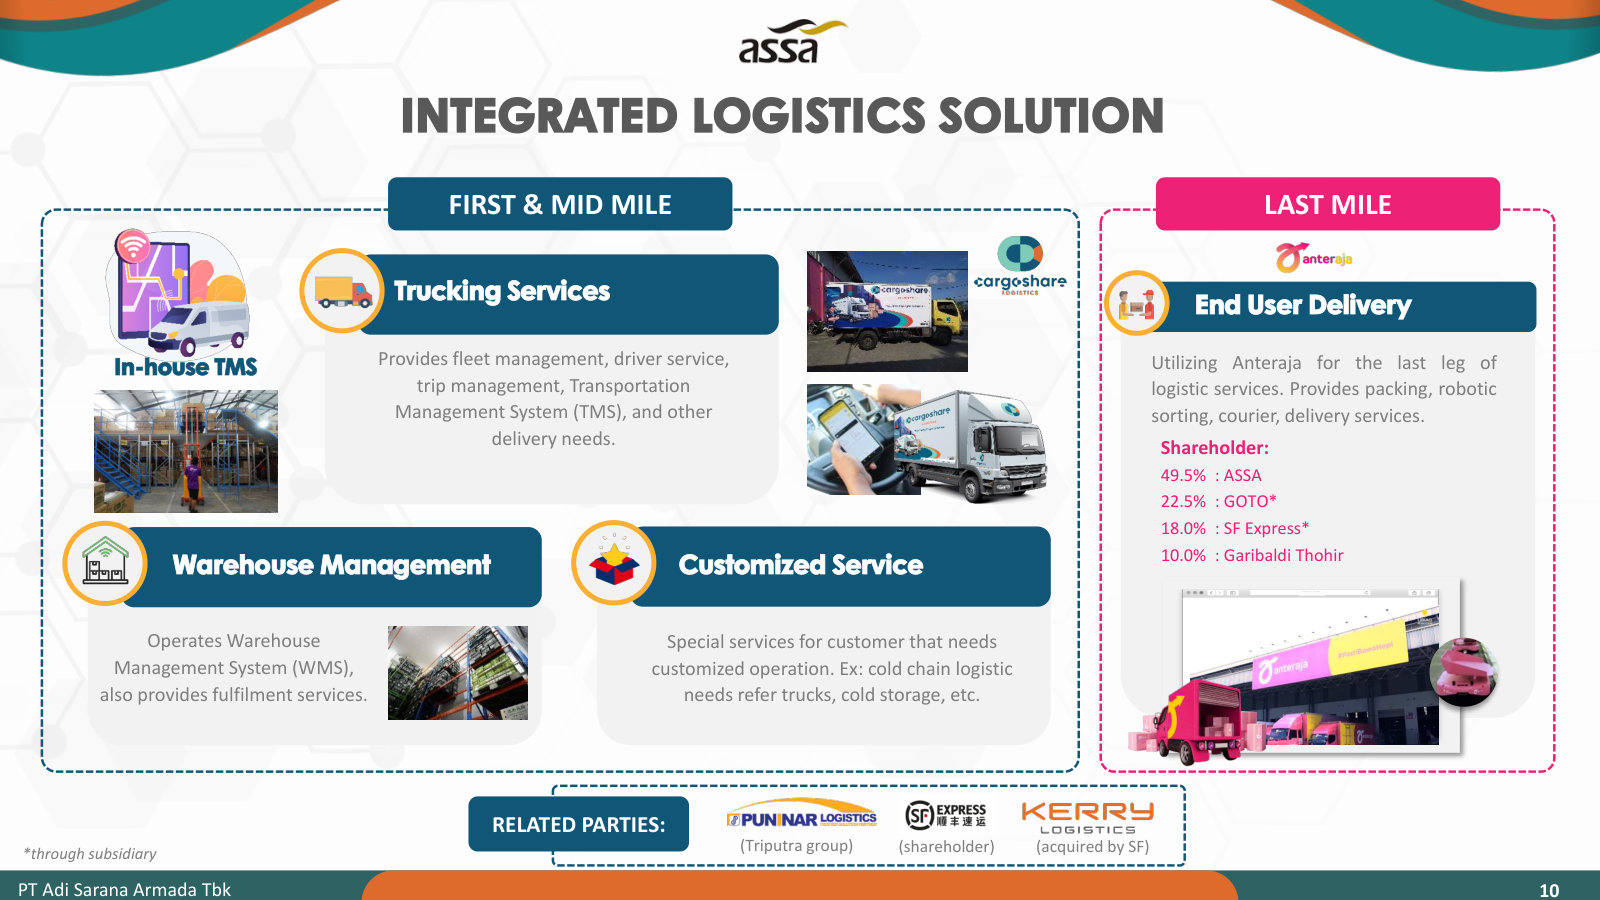
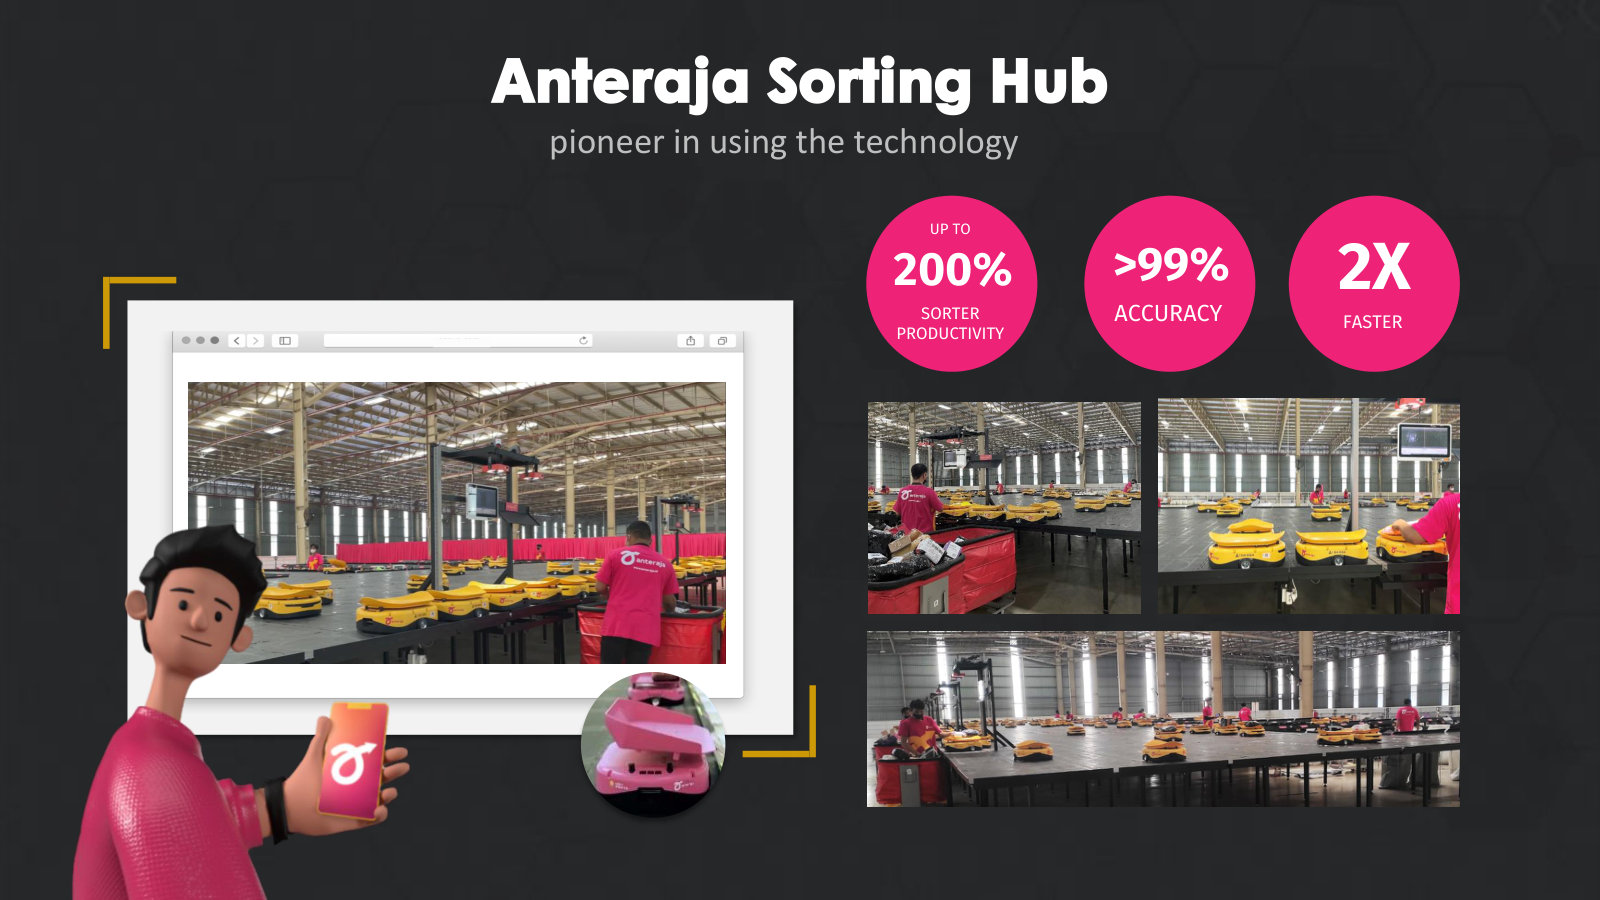
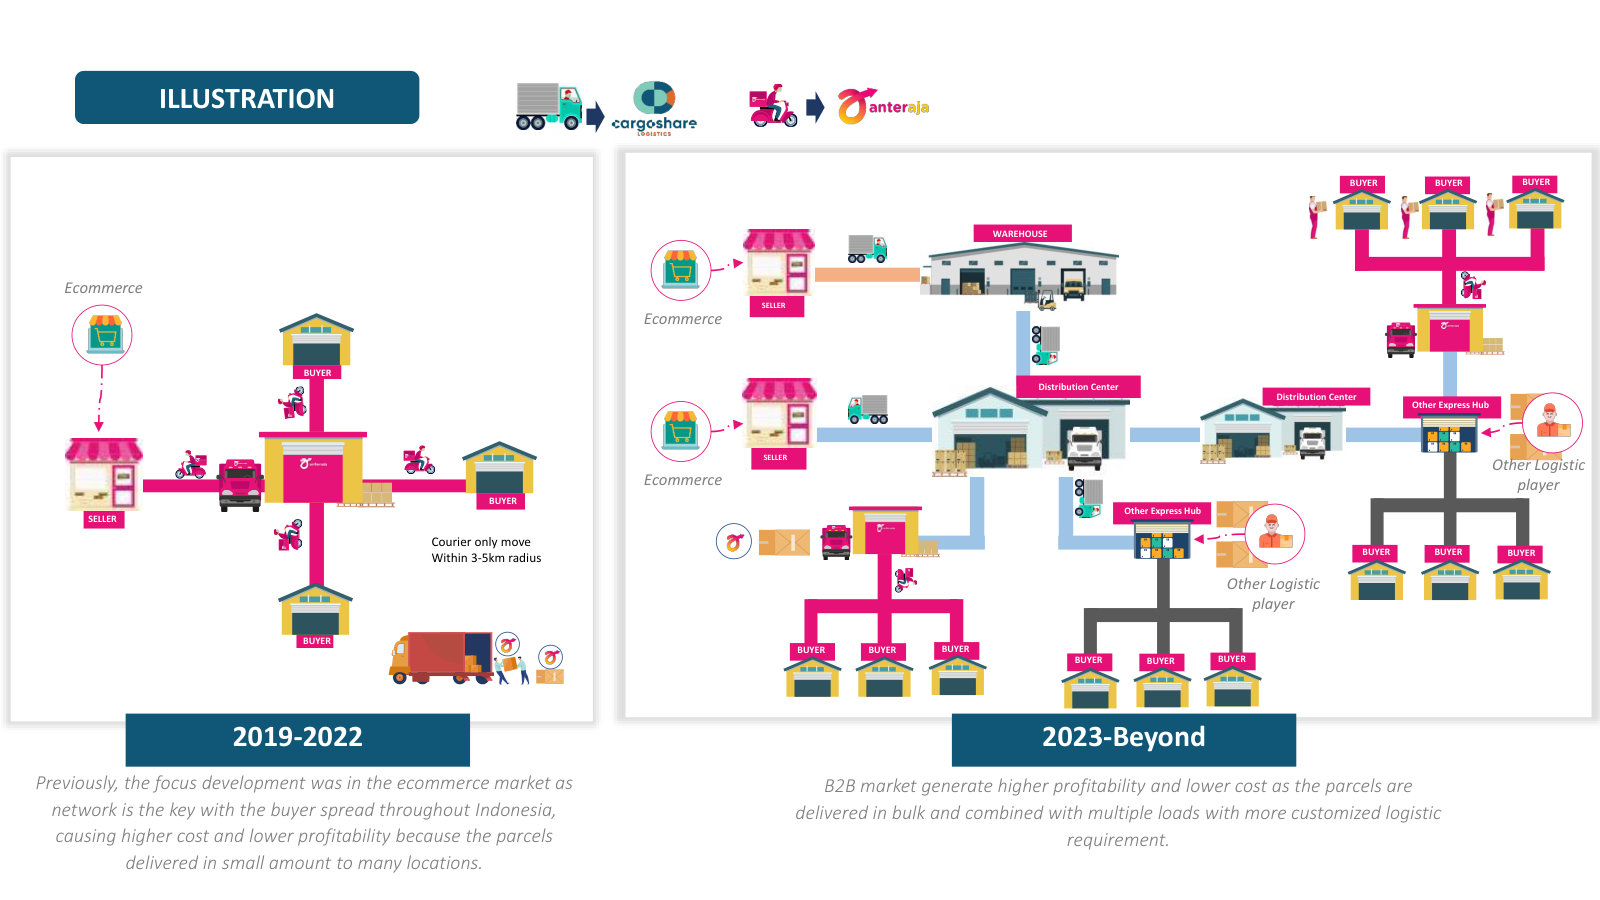
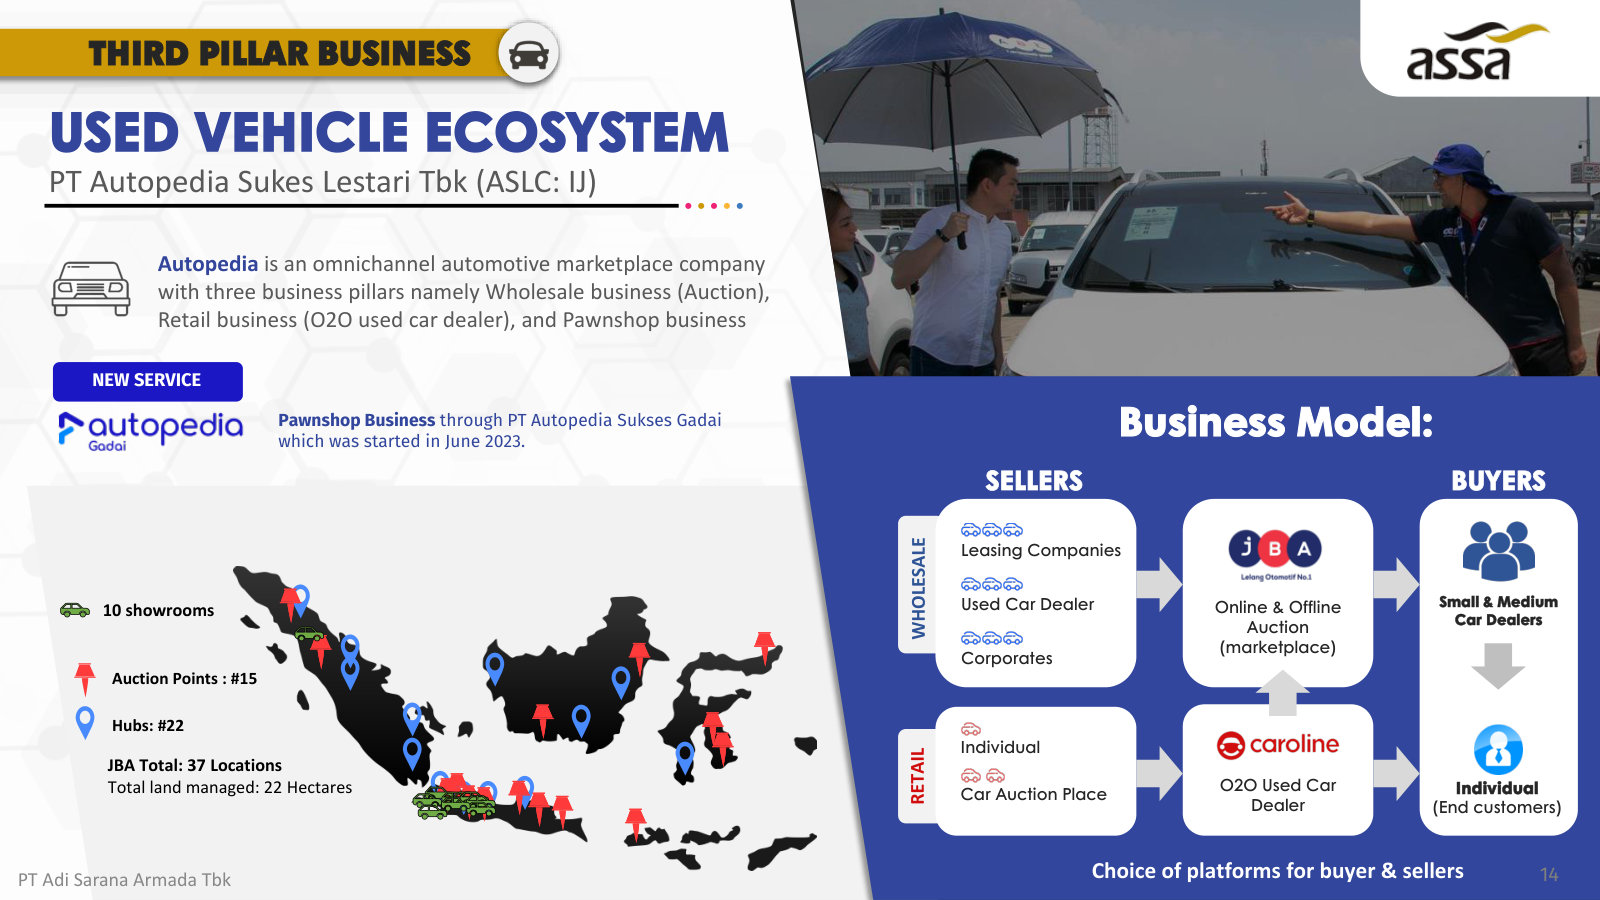
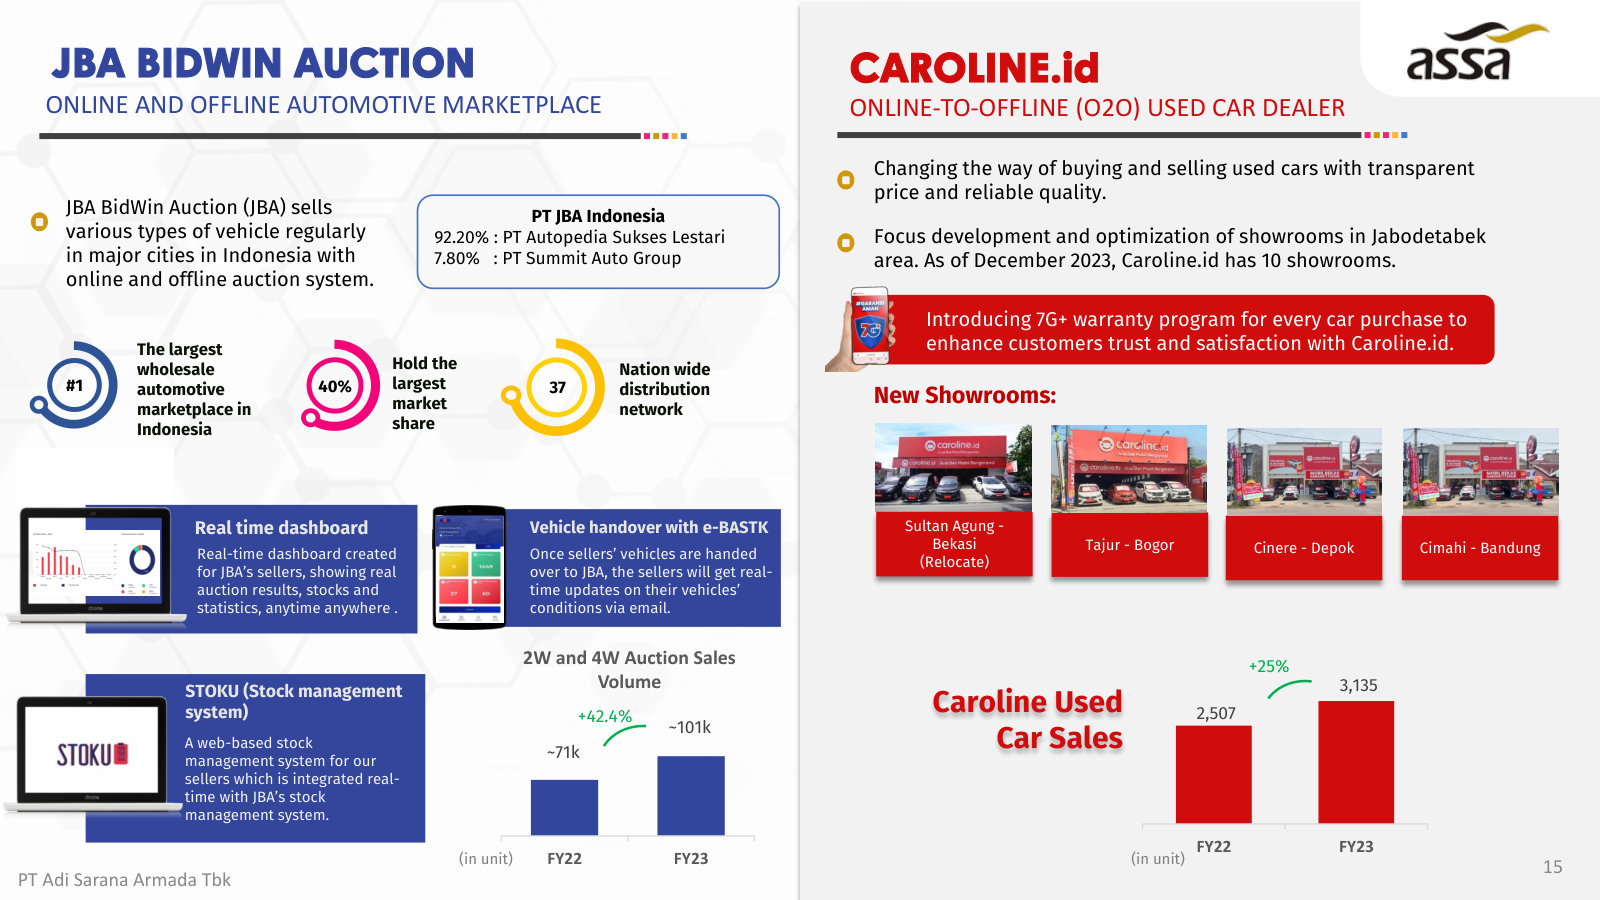
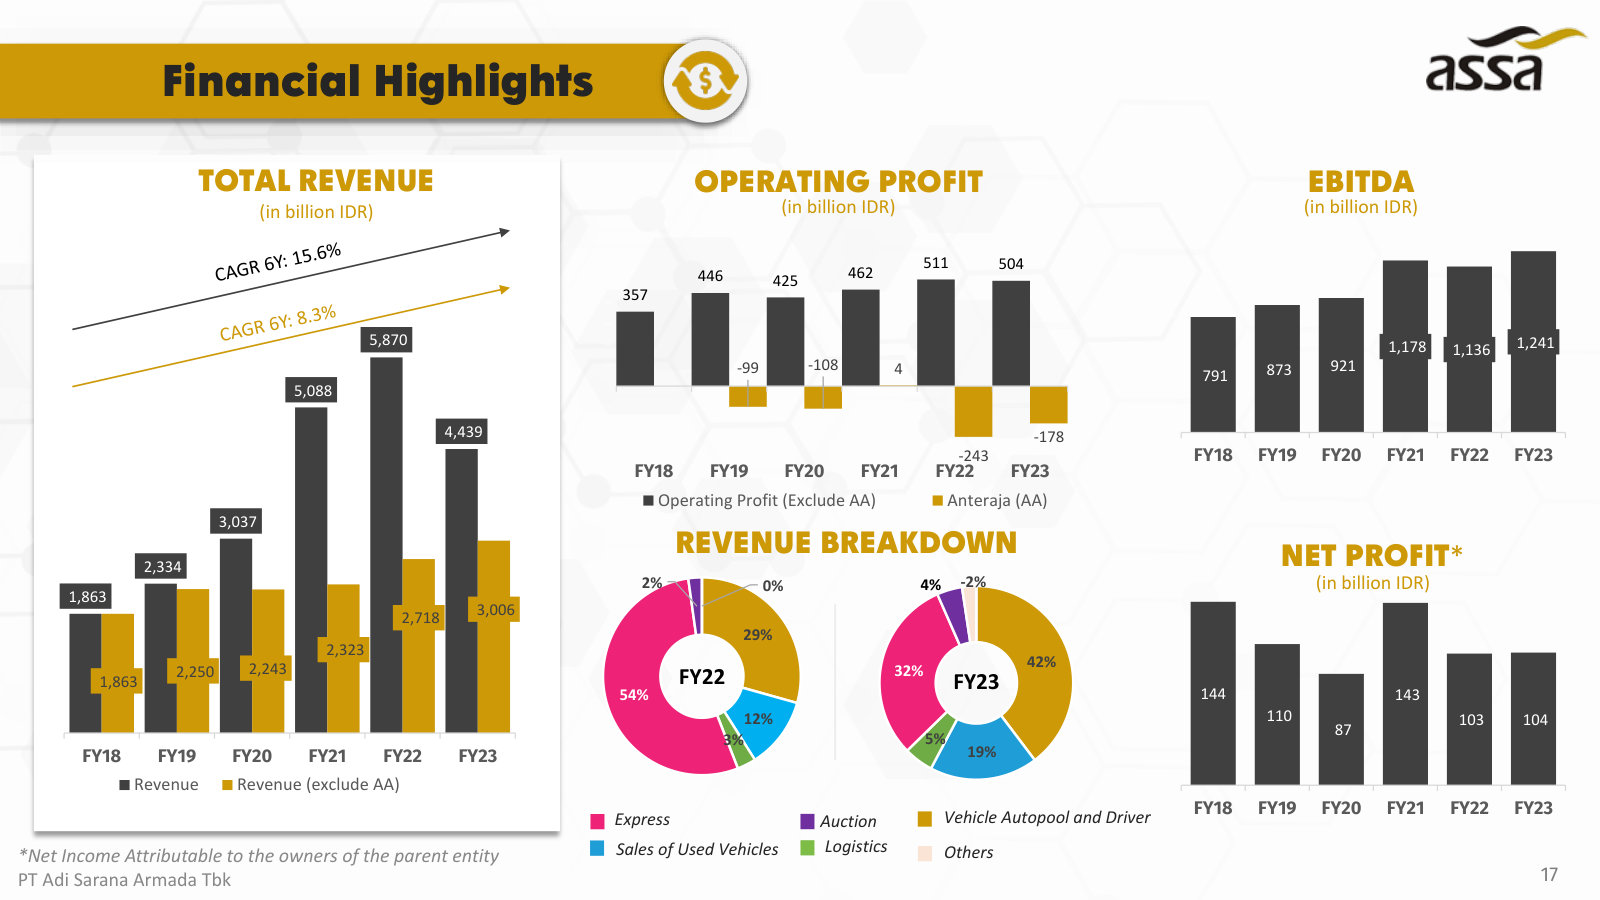
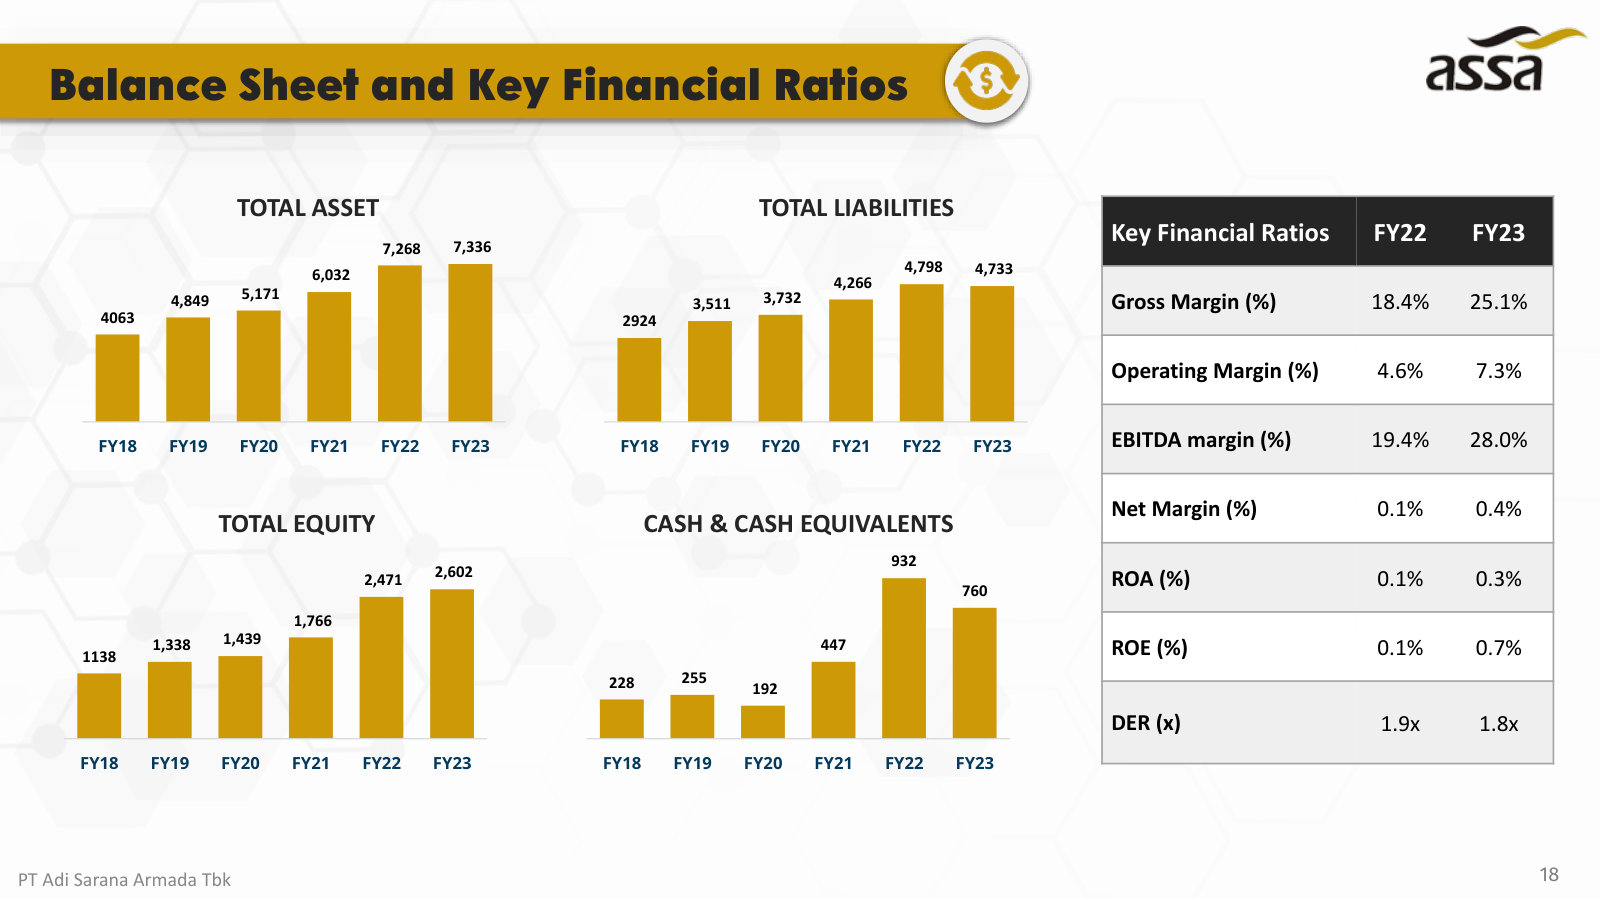
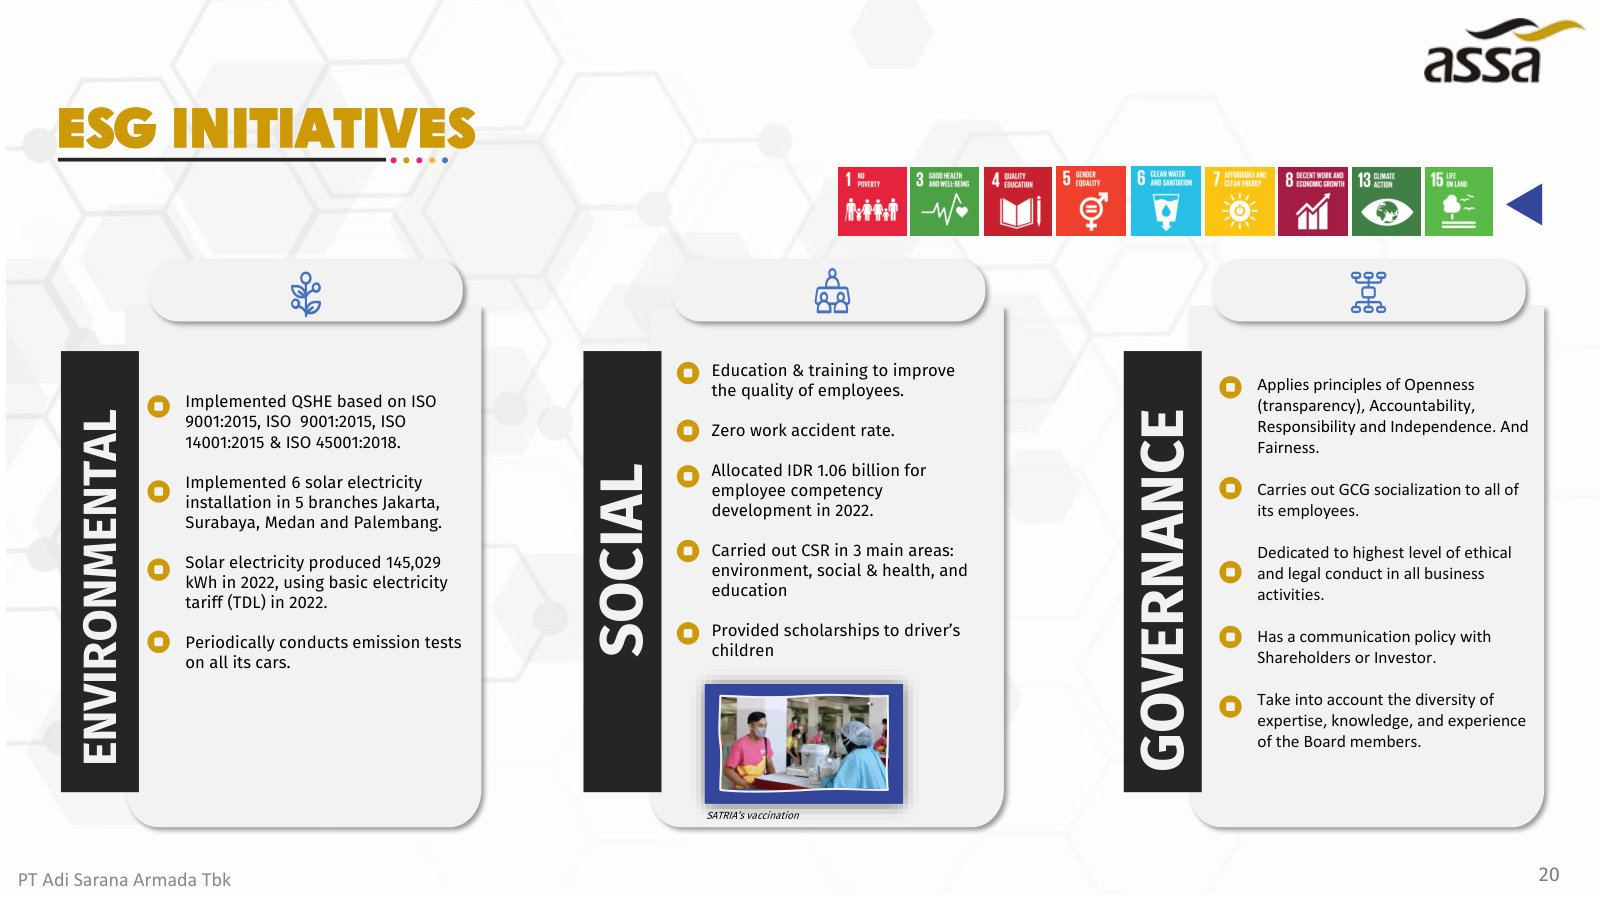
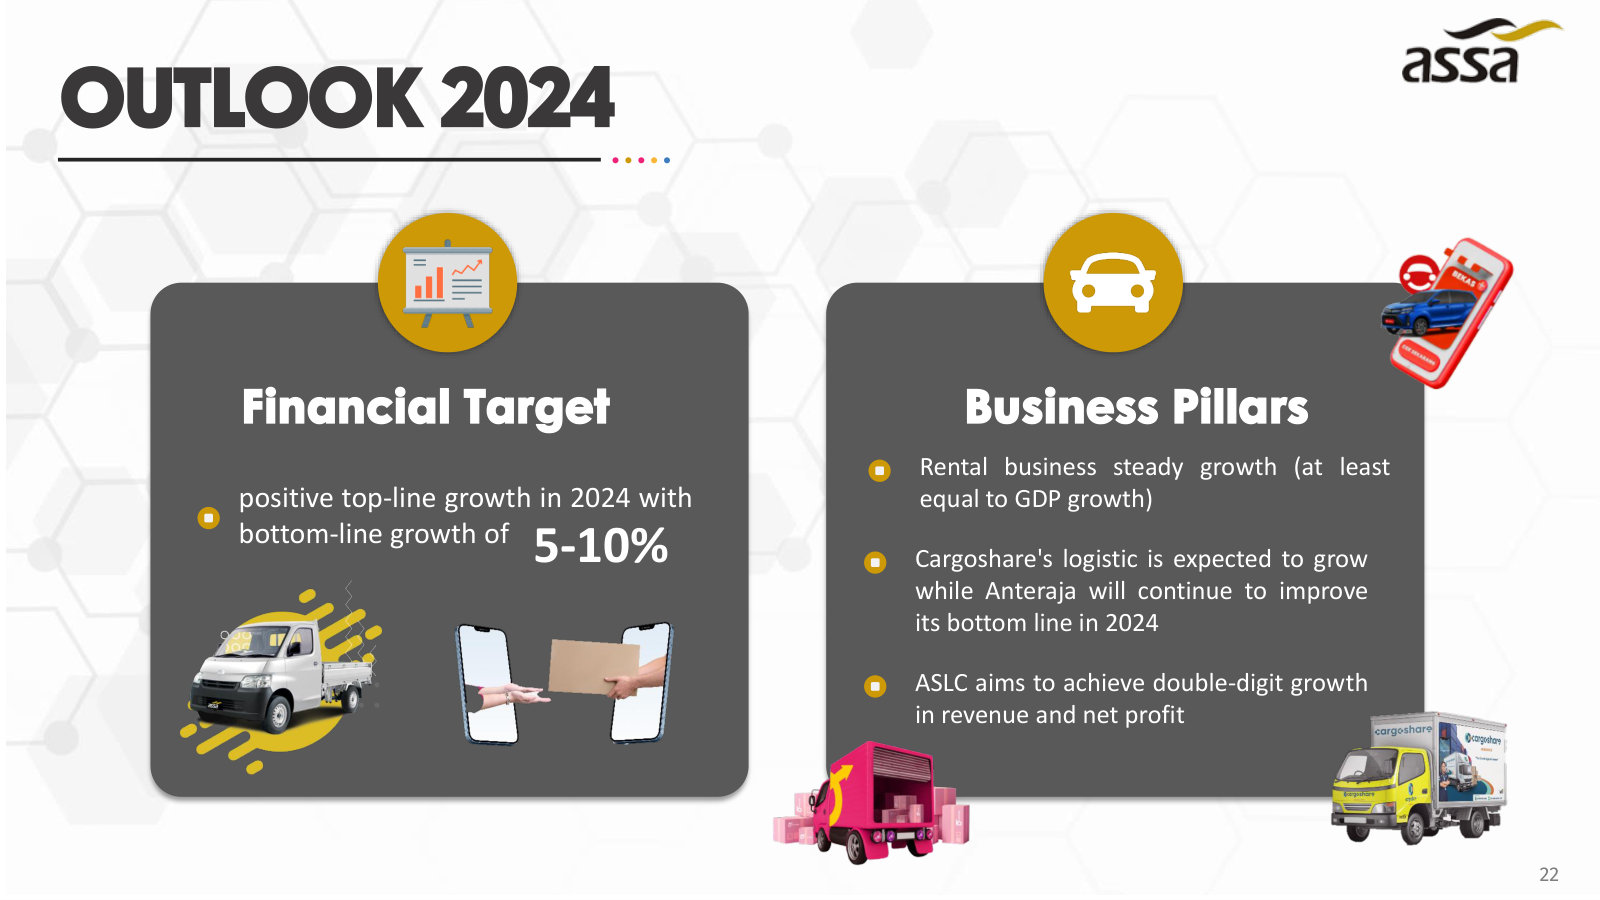
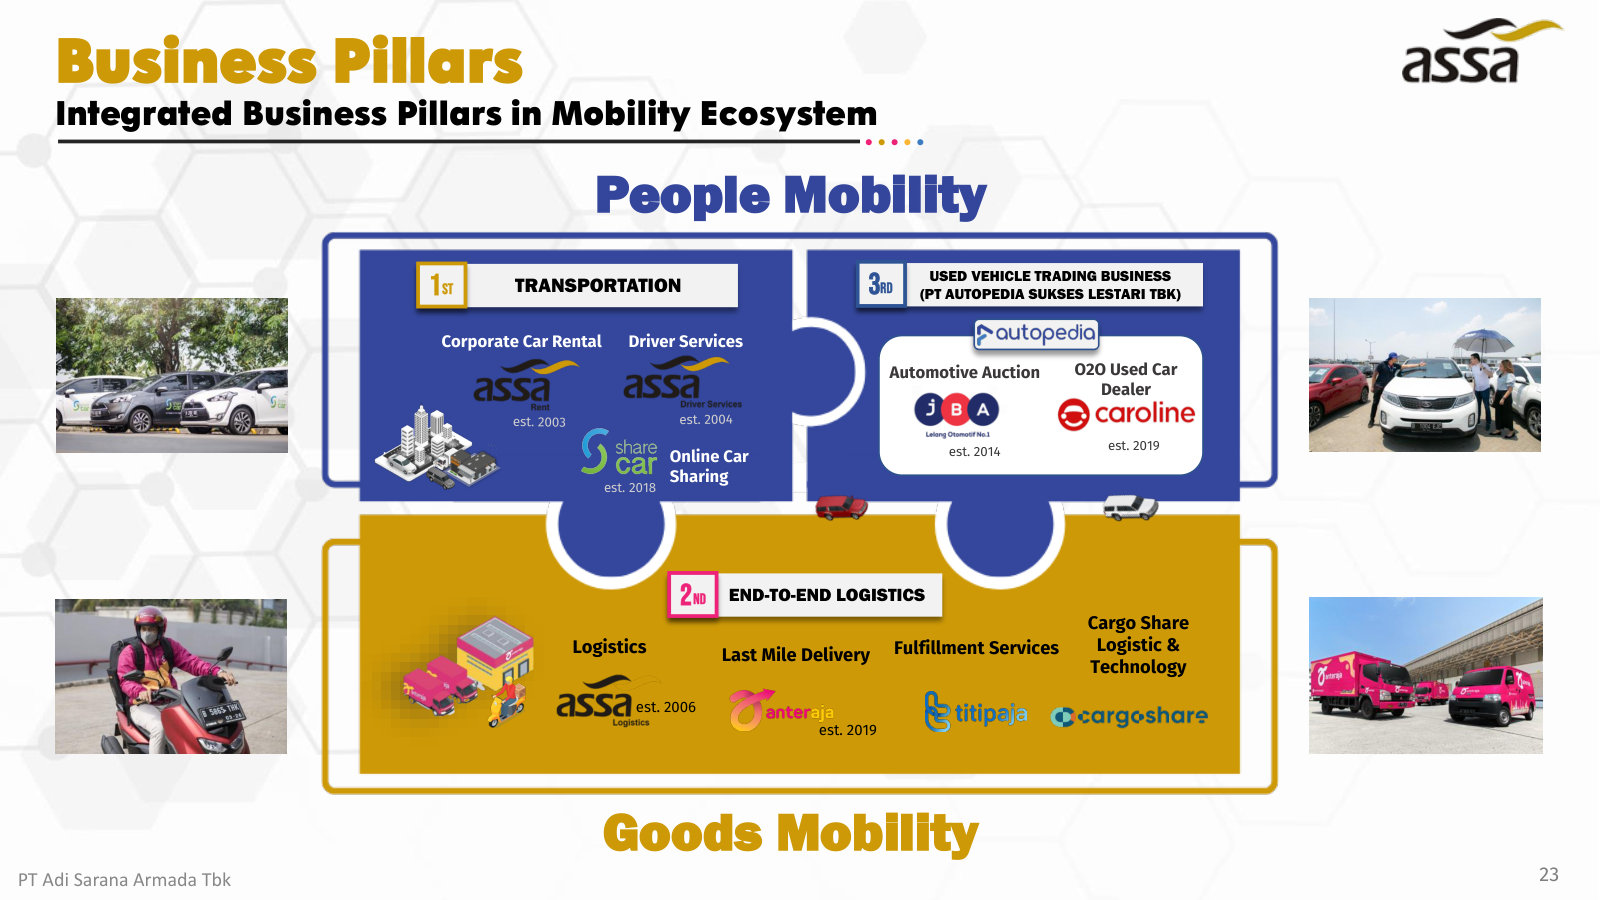
p. 4 — The three-pillar flywheel: transportation (2003), end-to-end logistics (2006) and used-vehicle sales (2014), with the brands under each. · Open the full presentation →p. 6 — Ownership: ASSA sits inside the Triputra Group; public float ~44%, with IFC on the register after a 2023 convertible-bond conversion. · Open the full presentation →p. 8 — First pillar, ASSA Rent: ~30,000 corporate fleet, 18 branches, and the buy / rent-4-years / sell model run at ~93% utilization. · Open the full presentation →p. 9 — How the logistics arm covers first, mid and last mile, and the 2006–2023 build from B2B trucking to Anteraja and cold chain. · Open the full presentation →p. 10 — The logistics stack in one view — in-house TMS, warehousing and Anteraja last-mile; note Anteraja's owners (ASSA 49.5%, GoTo, SF Express). · Open the full presentation →p. 11 — Anteraja's robotic sorting hubs — the automation behind its claimed 2x speed, >99% accuracy and higher sorter productivity. · Open the full presentation →p. 12 — Why delivery shifted toward B2B: bulk, consolidated loads cost less and earn more than spread-out e-commerce parcels. · Open the full presentation →p. 14 — Third pillar, Autopedia's used-vehicle ecosystem: wholesale auction (JBA), O2O retail (Caroline) and pawn, across 37 locations. · Open the full presentation →p. 15 — JBA, Indonesia's largest used-vehicle auction (~40% share), and Caroline's O2O retail — with auction and used-car sales volumes. · Open the full presentation →p. 17 — Six-year P&L: revenue, EBITDA and net profit, plus segment mix — and the Anteraja losses that drag reported operating profit. · Open the full presentation →p. 18 — Balance sheet and key ratios: asset and equity growth, cash, and margins / returns / leverage for FY22–FY23. · Open the full presentation →p. 20 — ESG on one page — certifications and solar use, workforce and CSR, and governance principles, mapped to UN SDGs. · Open the full presentation →p. 22 — Management's 2024 targets: positive top-line growth, 5–10% bottom-line growth, and the plan for each pillar. · Open the full presentation →p. 23 — The whole ecosystem as one map — People vs Goods mobility, and every brand's founding year. · Open the full presentation →
Featured only for slides the newer deck lacks: the rental brand/customer mix, the used-car market structure, and segment-level P&L history. · Open the full document →
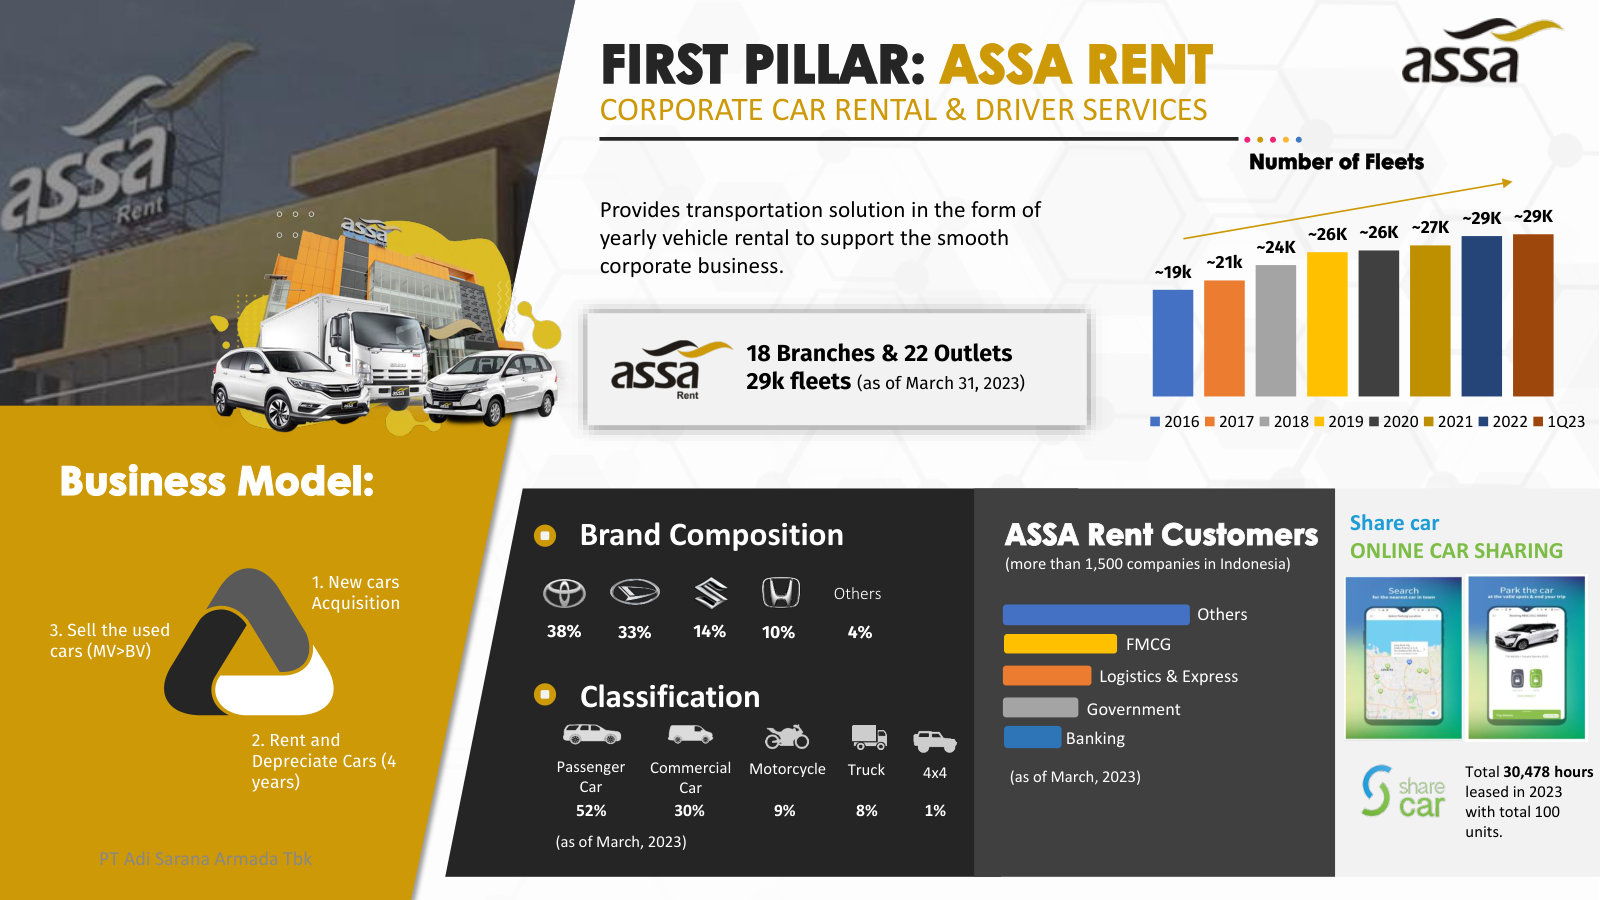
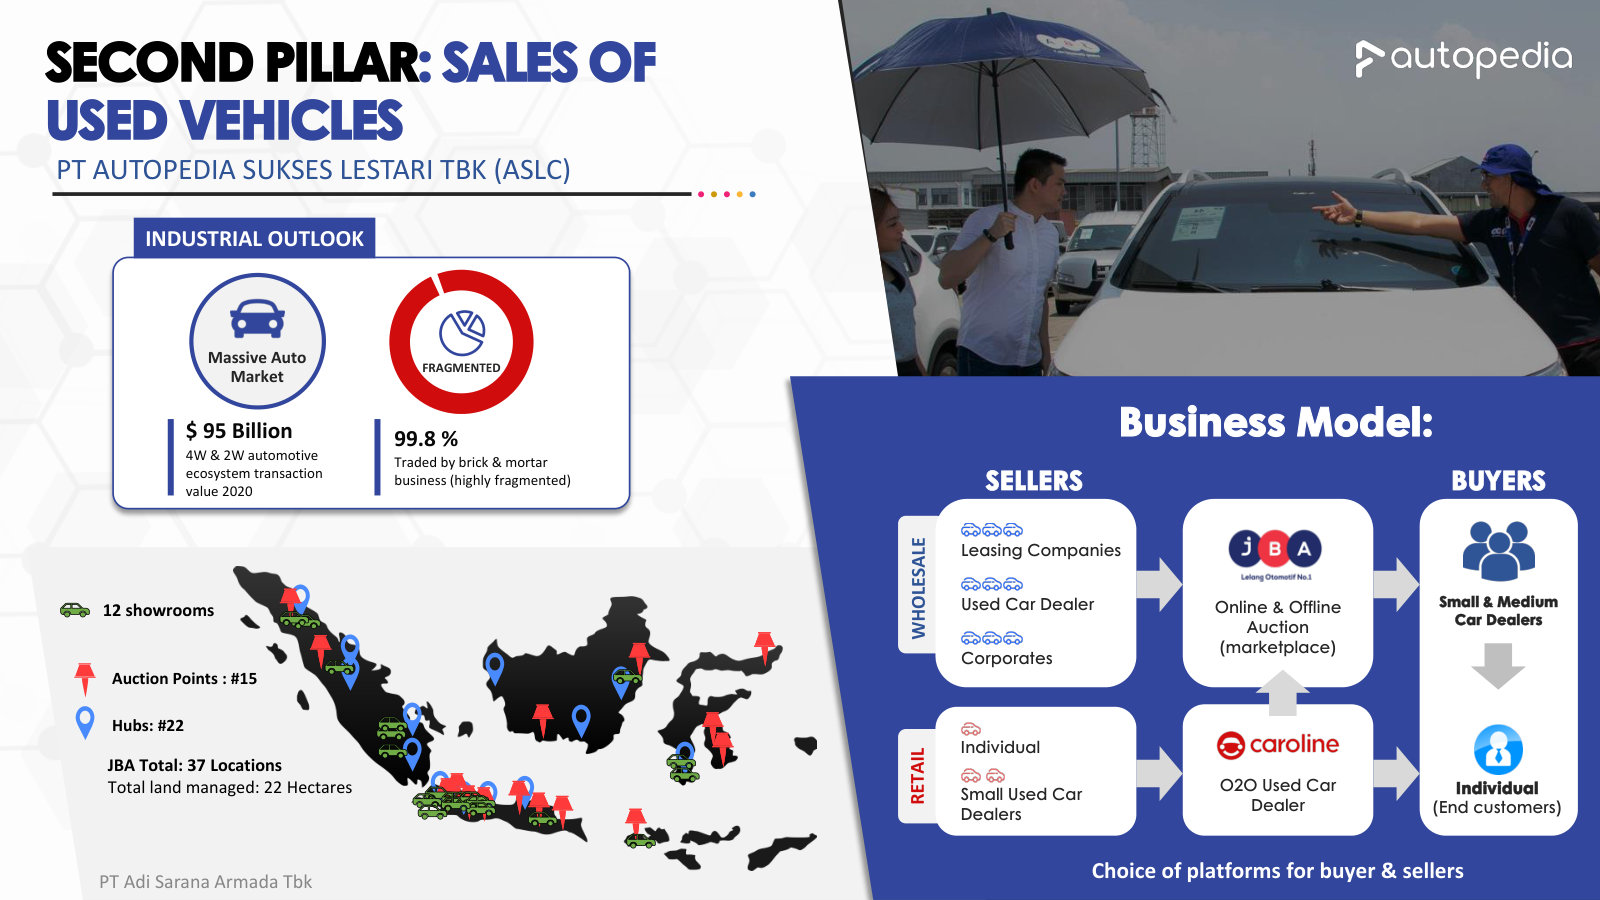
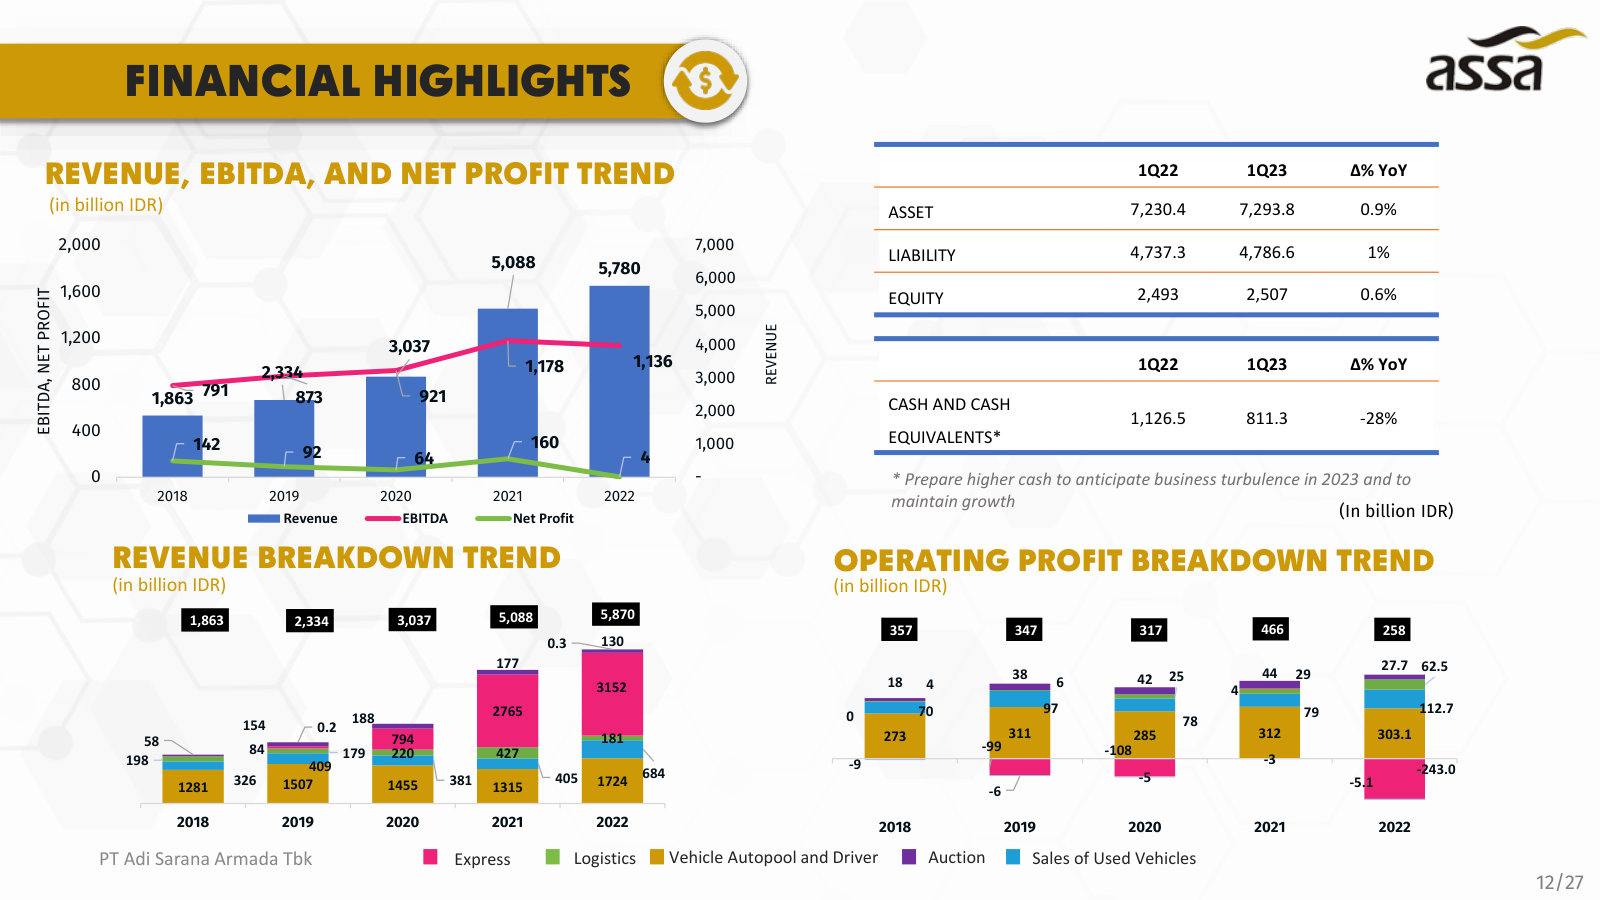
p. 6 — Fuller rental picture: fleet by brand (Toyota 38%, Daihatsu 33%…) and by type, and the customer mix across >1,500 corporate clients. · Open the full presentation →p. 7 — The used-vehicle opportunity: a ~$95bn auto market that is 99.8% fragmented brick-and-mortar, and Autopedia's buyer/seller model. · Open the full presentation →p. 12 — Segment-level history: revenue and operating profit by business over five years — showing Express/Anteraja as the loss driver. · Open the full presentation →