Full Report
The numbers behind PT Adi Sarana Armada Tbk: as-reported financial statements and company metrics for FY2023–FY2024, traced to the source filings, opened with the share-price history those statements have to justify. Every linked figure opens the exact page of the filing it was printed on, with the statement row highlighted. Amounts in Rp billion unless noted.
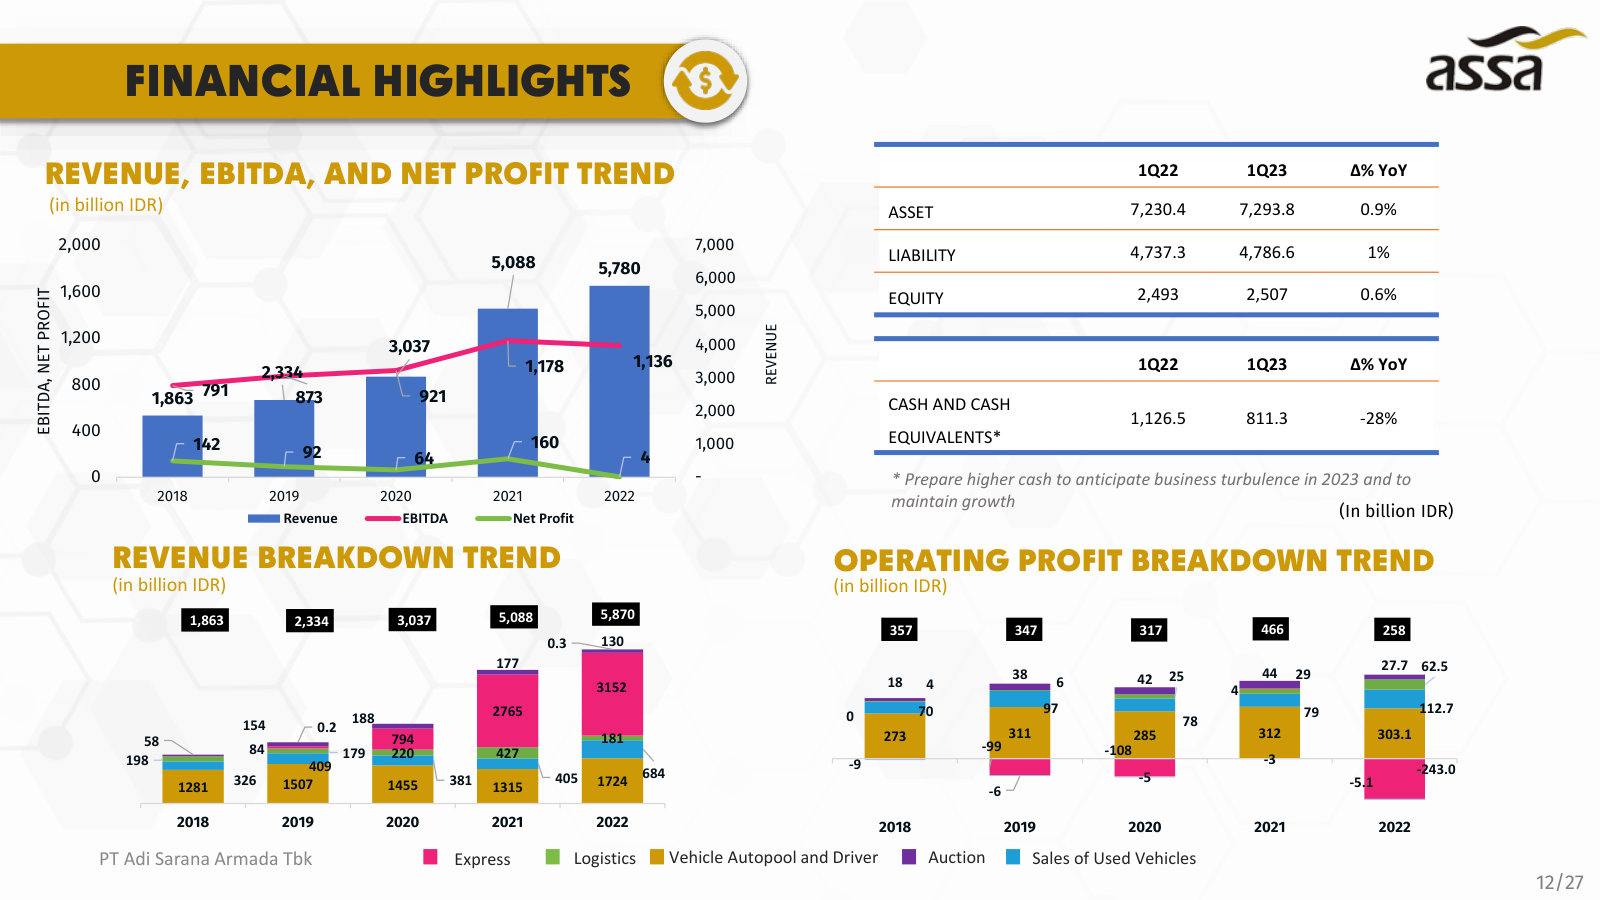
Reading notes: ASSA (IDX: ASSA) files no stand-alone annual report in this corpus; the annual figures are taken from the audited consolidated financial statements dated 31 December 2024 (which print FY2024 with FY2023 comparatives) and the six interim statement books (Q1 FY2024–Q3 FY2025). The structured numeric feed (data/financials/.json) is empty for this run (provider returned 0 annual periods), so every figure in this tab is sourced directly from the filings; there is no feed to cross-check against. Display unit is Rp billion; statements are printed in full Rupiah and each citation anchor is the verbatim full-Rupiah figure on the cited page. FY2018–FY2022 long-term figures and the FY2021/FY2022 total-revenue points are read from the FY2024 IR presentation's financial-highlights charts (rounded to Rp billion), not from audited statements held in this corpus; they are shown as page-linked to that deck.*
Share Price — Available History Since January 2026
The stock closed at IDR 635 on Jul 17, 2026 — down 48% over the window shown, trading between IDR 520 and IDR 1,245.
Source: market price feed, daily closes, Jan 2026–Jul 2026 — the feed marks this available history as partial. Price return only, excludes dividends.
FY2024 at a Glance
Operating income (Rp billion)
Net income (Rp billion)
Source: FY2024 consolidated statements [1] [2]. Click any linked figure to open the filing page with the row highlighted.
Revenue by Activity
| Revenue by Activity | FY2023 | FY2024 |
|---|---|---|
| Logistic services | 1,662.7 | 1,913.7 |
| Passenger vehicle lease and autopool | 1,531.6 | 1,593.5 |
| Sale of used vehicles | 732.3 | 864.0 |
| Driver lease | 315.3 | 310.4 |
| Auction | 196.4 | 264.8 |
| Others | 0.3 | 9.5 |
| Total revenue | 4,438.5 | 4,955.9 |
| Total revenue growth, derived | — | +11.7% |
Source: Note 25 — Revenues (consolidated); FY2021/FY2022 total from FY2024 IR presentation [3]. Click any linked figure to open the filing page with the row highlighted.
Operating Profit by Segment
| Operating Profit by Segment | FY2023 | FY2024 |
|---|---|---|
| Vehicle lease, autopool, share cars and driver | 333 | 278 |
| Sale of used vehicle | 120 | 137 |
| Logistics | (148) | 216 |
| Auction | 63 | 85 |
| Others | (4) | (2) |
| Inter-segment elimination | (37) | (9) |
| Operating profit | 326 | 705 |
Source: Note 34 — Segment Information (by service type) [4] [5]. Click any linked figure to open the filing page with the row highlighted.
Income Statement
Source: Consolidated Statement of Profit or Loss and Other Comprehensive Income [1] [2]. Click any linked figure to open the filing page with the row highlighted.
Columns marked E are consensus analyst estimates shown alongside reported results for direct comparison; they are not company guidance.
Estimate source: analyst consensus (claude_web), as of 2026-07-17. Forecasts carry no filing page links.
Balance Sheet
Source: Consolidated Statement of Financial Position [6] [7]. Click any linked figure to open the filing page with the row highlighted.
Cash Flow
| Cash Flow | FY2023 | FY2024 |
|---|---|---|
| Net cash provided by operating activities | 482 | 748 |
| Purchases of fixed assets - leased vehicles | (1,104) | (1,111) |
| Proceeds from sales of used vehicles inventories | 732 | 864 |
| Acquisition of fixed assets and advances for purchase | (192) | (423) |
| Net cash used in investing activities | (366) | (582) |
| Proceeds from long-term debts | 1,861 | 1,356 |
| Payments of long-term debts | (1,522) | (1,046) |
| Payment of dividend | (5) | (150) |
| Net cash used in financing activities | (290) | (333) |
| Net decrease in cash and cash equivalents | (172) | (167) |
Source: Consolidated Statement of Cash Flows [8] [9]. Click any linked figure to open the filing page with the row highlighted.
ASSA Rent — Fleet Utilization
| ASSA Rent — Fleet Utilization | FY2023 | FY2024 |
|---|---|---|
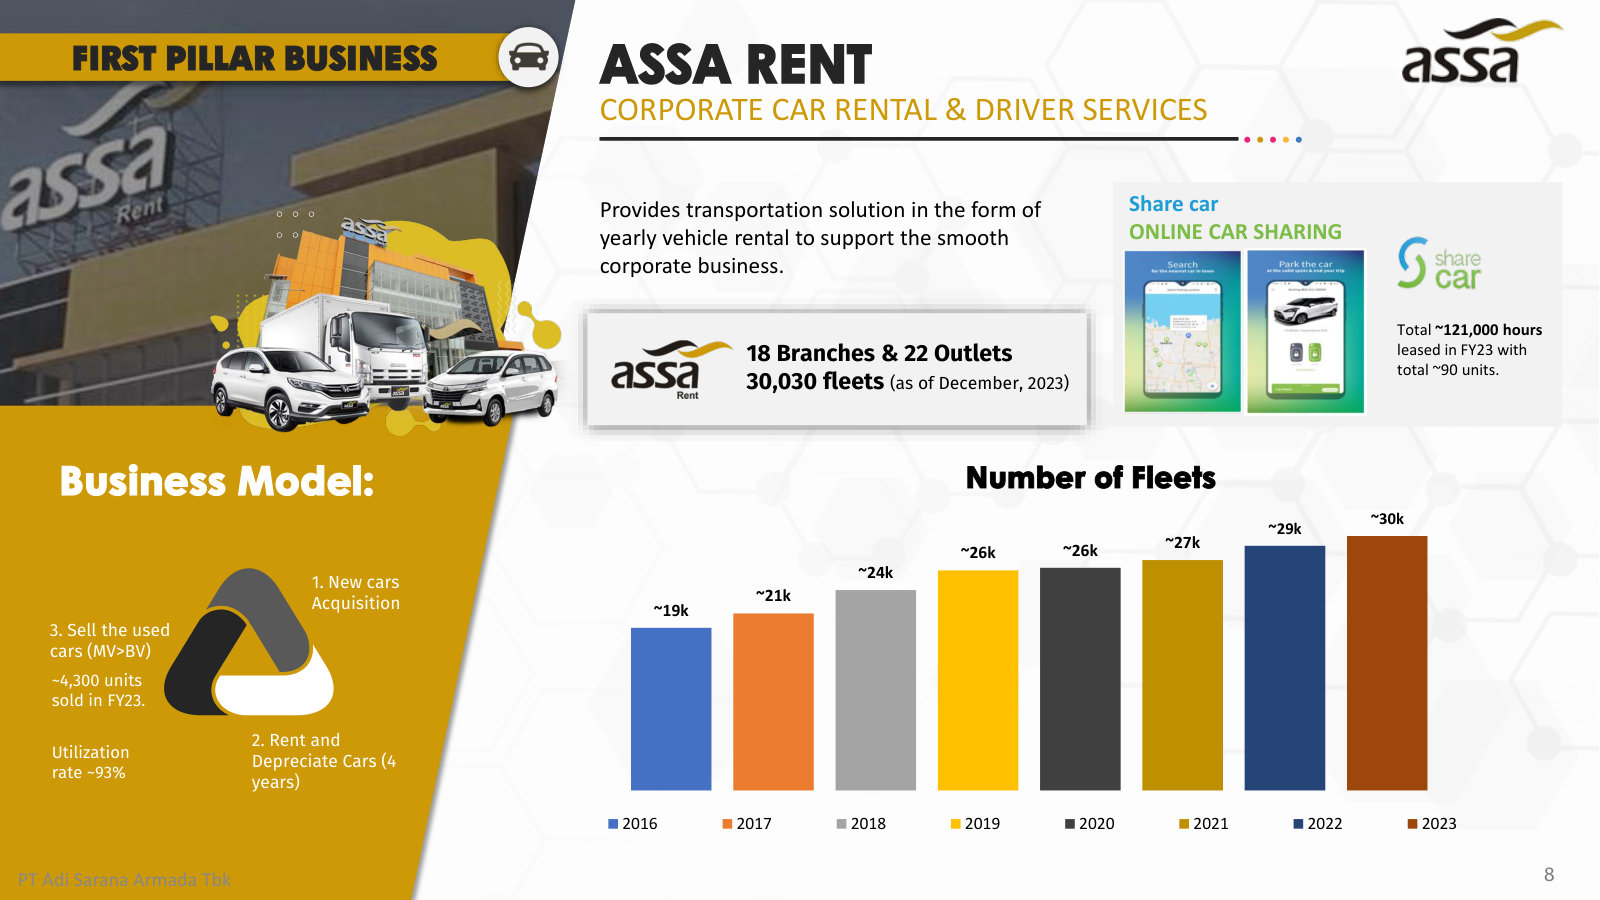
| Managed rental fleet (units) | 30,030 | — |
| Fleet utilization rate (%) | 93.0% | — |
| Corporate rental customers (companies) | 1,500 | — |
| Ex-fleet used vehicles sold (units) | 4,300 | — |
| Share-car hours leased | 121,000 | — |
| Rental branches | 18 | — |
| Rental outlets | 22 | — |
Source: company filings [10] [11]. Click any linked figure to open the filing page with the row highlighted.
Used-Vehicle Ecosystem (Autopedia — JBA Auction Caroline)
| Used-Vehicle Ecosystem (Autopedia — JBA Auction Caroline) | FY2023 | FY2024 |
|---|---|---|
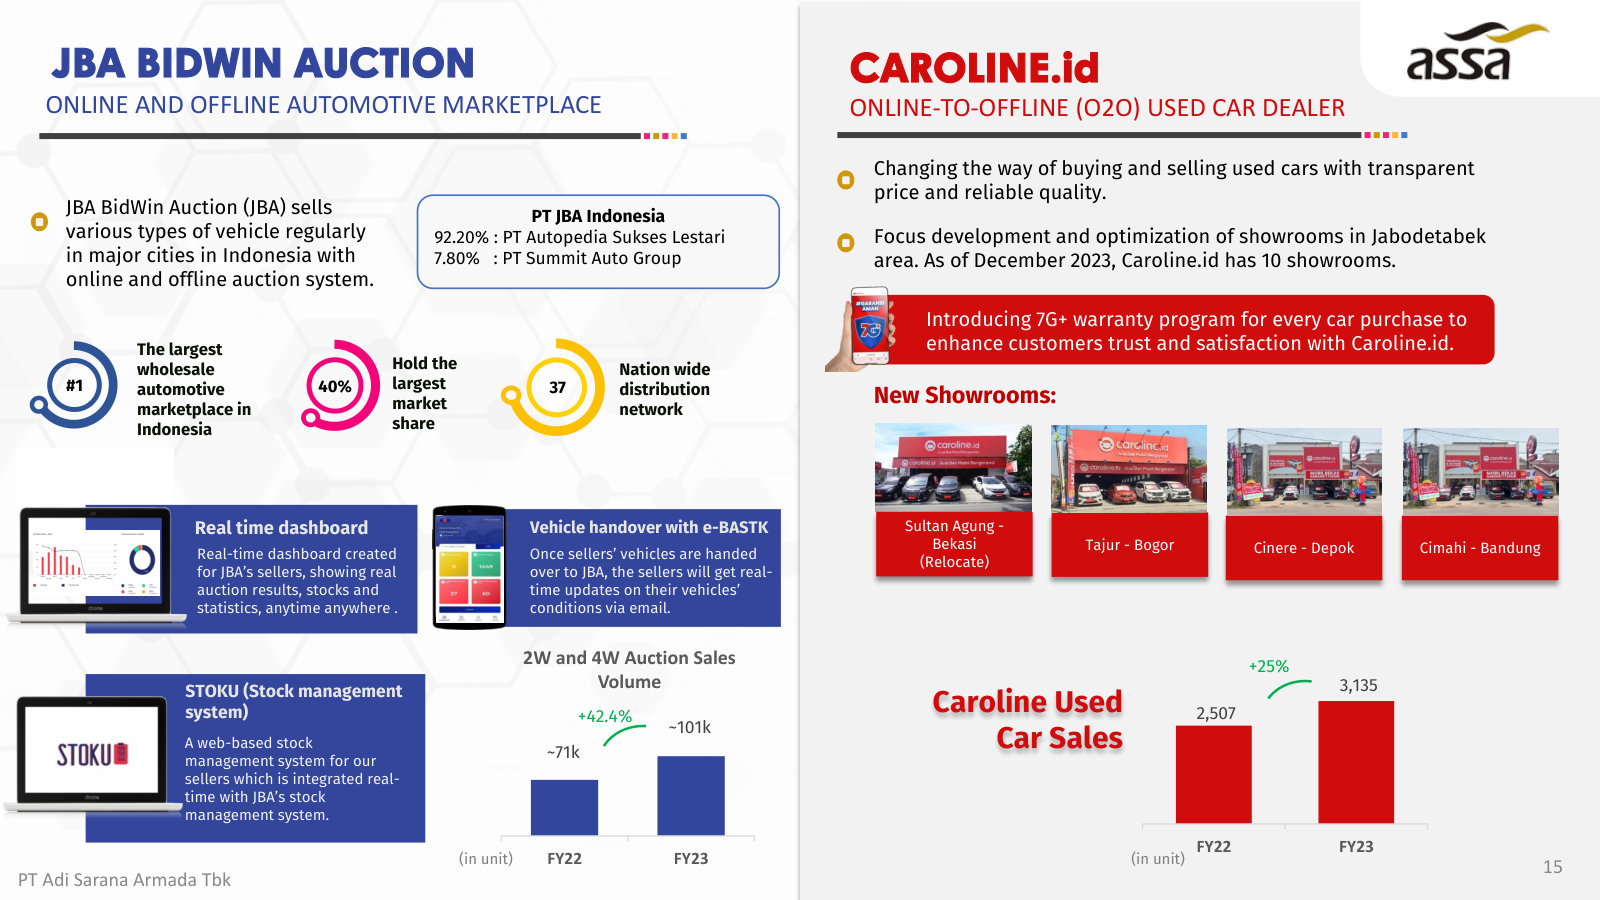
| Auction sales volume — 2W 4W (units) | 101,000 | — |
| Caroline.id retail used cars sold (units) | 3,135 | — |
| Caroline.id showrooms | 10 | — |
| JBA auction points | 15 | — |
| JBA hubs | 22 | — |
| JBA total locations | 37 | — |
Source: company filings [12] [13]. Click any linked figure to open the filing page with the row highlighted.
Logistics Workforce
| Logistics Workforce | FY2023 | FY2024 |
|---|---|---|
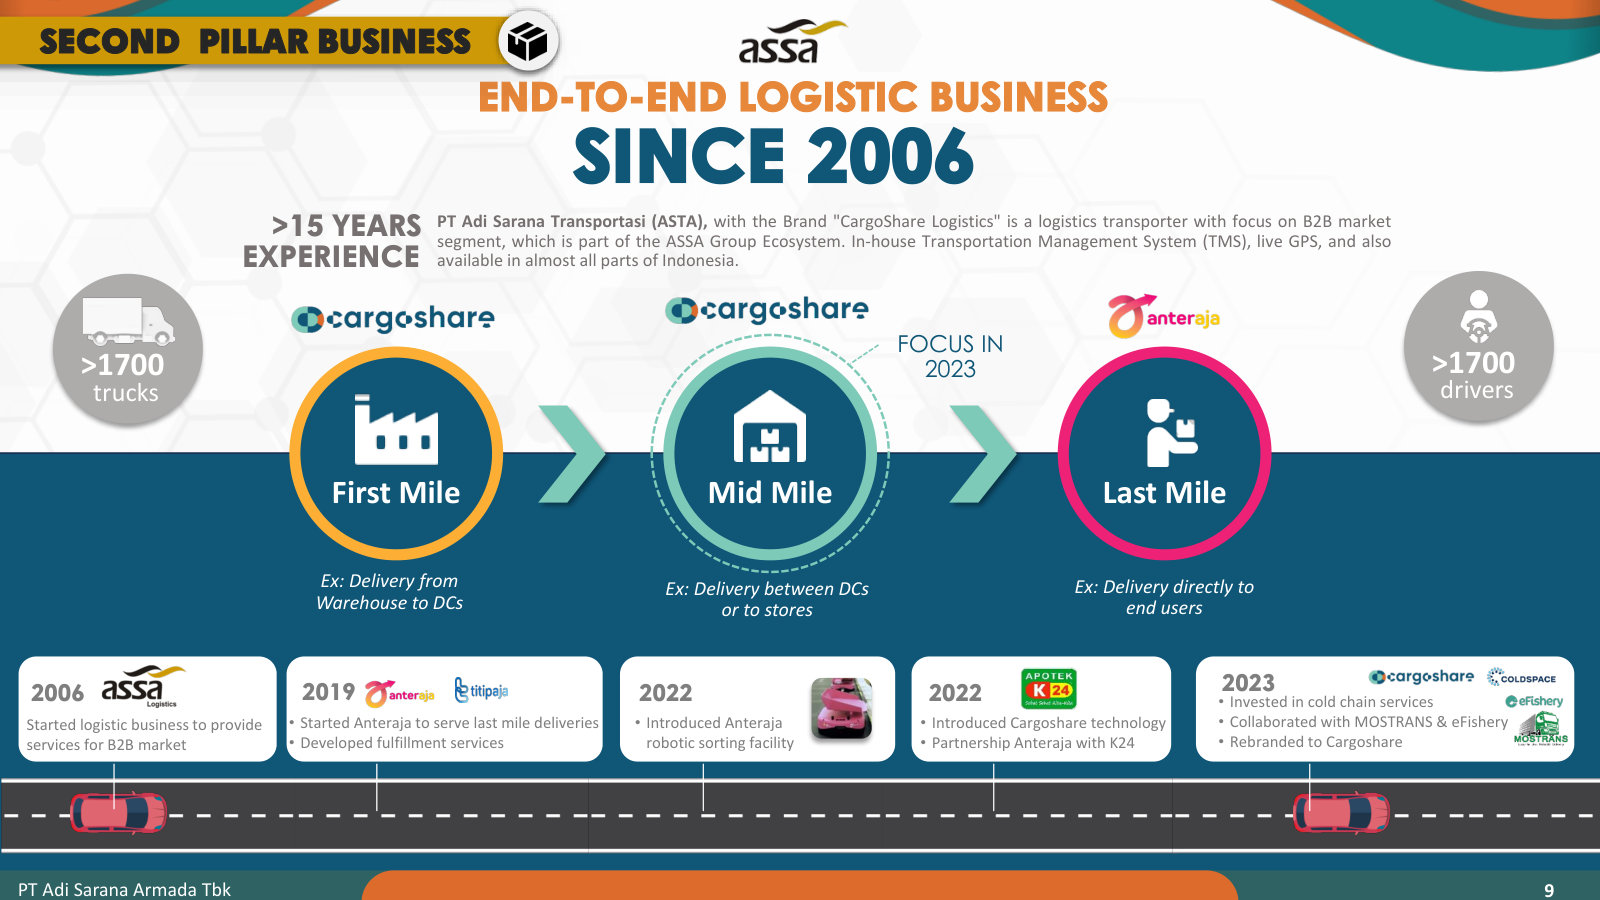
| Cargoshare logistics trucks | 1,700 | — |
| Logistics drivers | 1,700 | — |
| Permanent employees (Group) | 1,390 | 1,552 |
Source: company filings [14] [15]. Click any linked figure to open the filing page with the row highlighted.
Profitability Returns (as reported)
| Profitability Returns (as reported) | FY2023 | FY2024 |
|---|---|---|
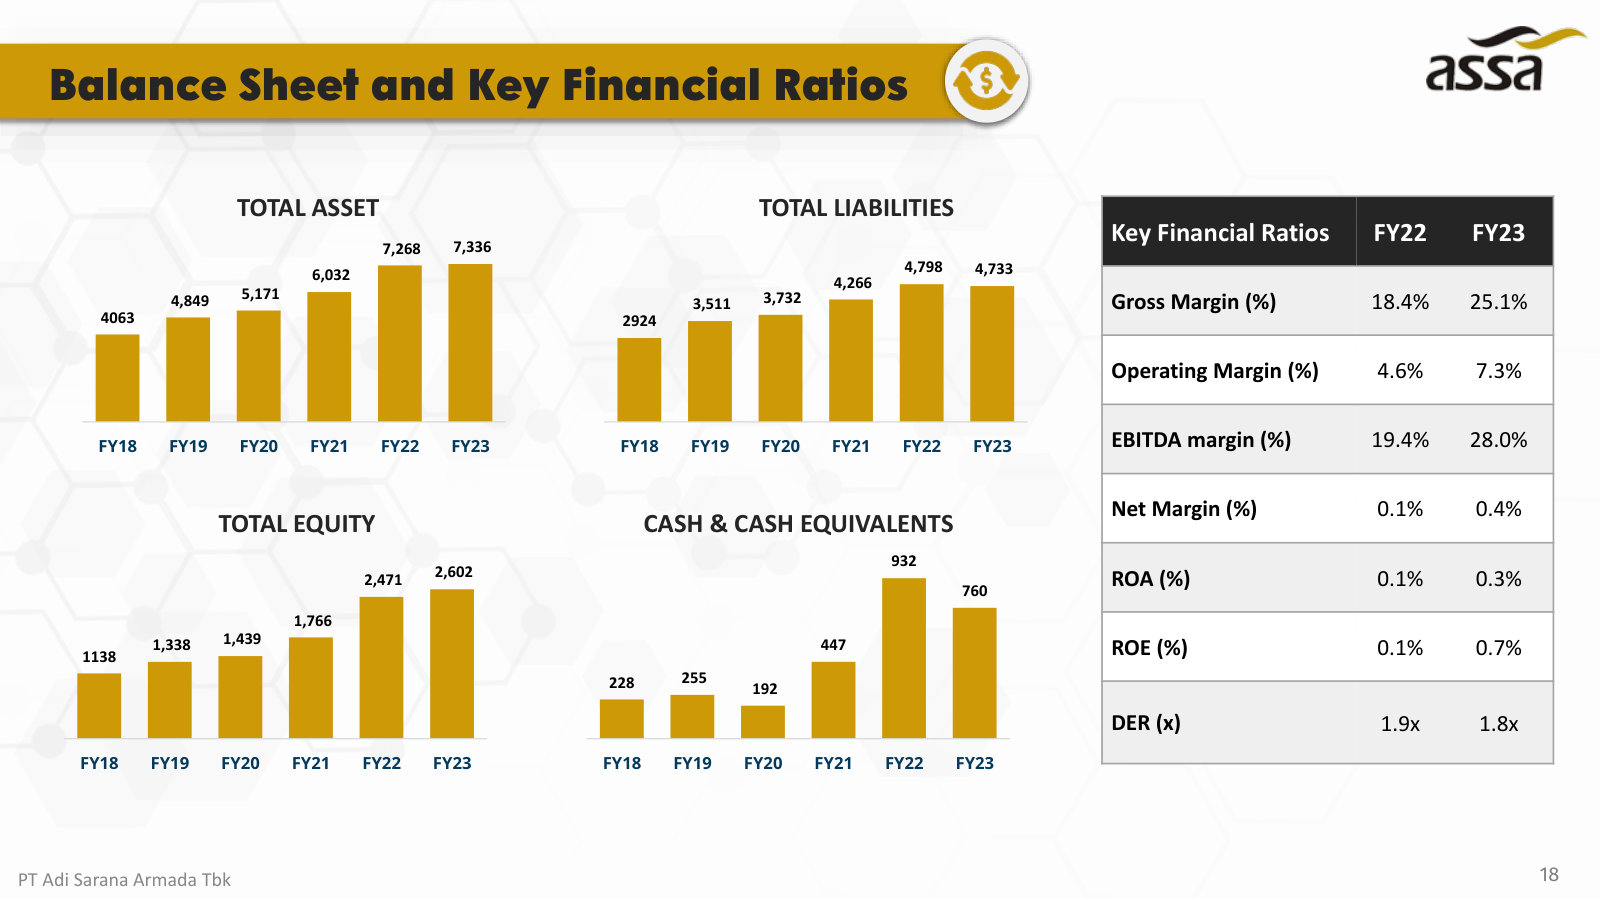
| EBITDA | 1,241 | — |
| Gross margin (%) | 25.1% | — |
| Operating margin (%) | 7.3% | — |
| EBITDA margin (%) | 28.0% | — |
| Return on assets (%) | 0.3% | — |
| Return on equity (%) | 0.7% | — |
| Debt-to-equity (x) | 1.8 | — |
Source: company filings [16] [17]. Click any linked figure to open the filing page with the row highlighted.
Long-Term Record
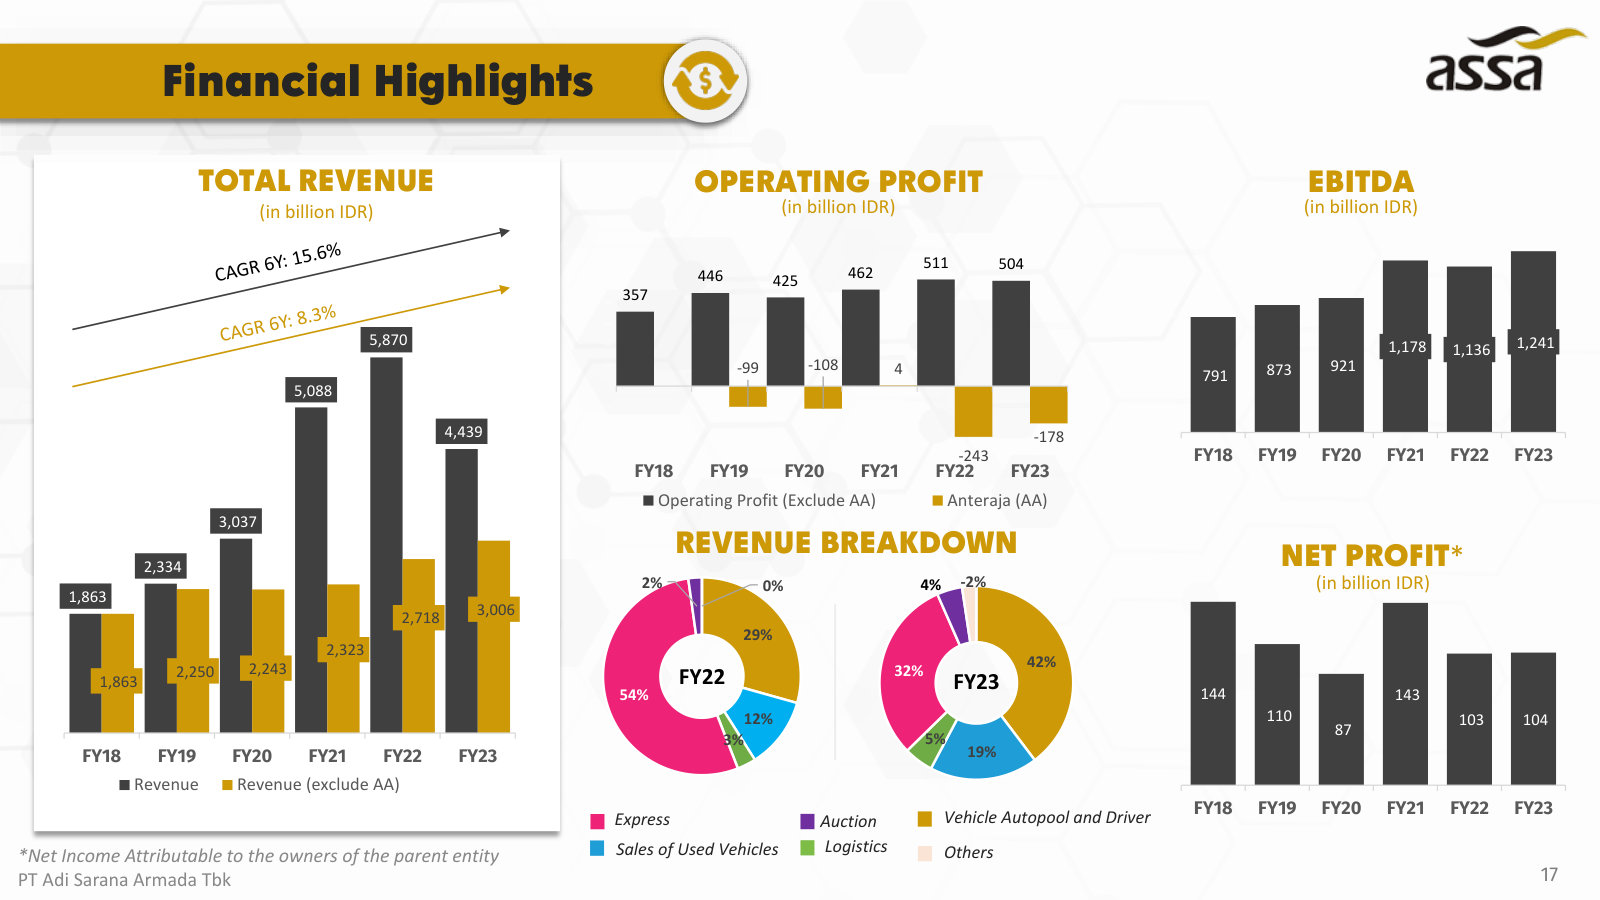
| Fiscal year | Total revenue | Net income (attributable to owners of parent) | Total assets | Total equity |
|---|---|---|---|---|
| FY2018 | 1,863 | 144 | 4,063 | 1,138 |
| FY2019 | 2,334 | 110 | 4,849 | 1,338 |
| FY2020 | 3,037 | 87 | 5,171 | 1,439 |
| FY2021 | 5,088 | 143 | 6,032 | 1,766 |
| FY2022 | 5,870 | 103 | 7,268 | 2,471 |
| FY2023 | 4,439 | 104 | 7,336 | 2,602 |
| FY2024 | 4,956 | 244 | 7,724 | 2,783 |
Source: consolidated statements across filings; older years from the standardized feed [3] [1] [6] [7]. Click any linked figure to open the filing page with the row highlighted.
Analyst Consensus
Mean target
Street ratings: Consensus rating: Strong Buy. Approximately 3-4 analysts cover the stock — roughly 3 Strong Buy, 1 Buy, 0 Hold, 0 Sell. Mean 12-month price target ~IDR 1,335 (range IDR 1,070–1,600 per stockanalysis.com); an alternate aggregator shows a mean ~IDR 1,703 (range 1,600–1,810). Significant upside implied vs. current price.
Estimate source: analyst consensus (claude_web), as of 2026-07-17. Forecasts carry no filing page links.
Traceability
201 of 201 figures on this page (100%) link to the filing page where they are printed — click a linked figure to open the source PDF at that page with the row highlighted. Unlinked figures come from standardized data feeds or pre-filing years.
ASSA (IDX: ASSA) files no stand-alone annual report in this corpus; the annual figures are taken from the audited consolidated financial statements dated 31 December 2024 (which print FY2024 with FY2023 comparatives) and the six interim statement books (Q1 FY2024–Q3 FY2025).
The structured numeric feed (data/financials/*.json) is empty for this run (provider returned 0 annual periods), so every figure in this tab is sourced directly from the filings; there is no feed to cross-check against.
Display unit is Rp billion; statements are printed in full Rupiah and each citation anchor is the verbatim full-Rupiah figure on the cited page.
FY2018–FY2022 long-term figures and the FY2021/FY2022 total-revenue points are read from the FY2024 IR presentation's financial-highlights charts (rounded to Rp billion), not from audited statements held in this corpus; they are shown as page-linked to that deck.
Reported revenue for FY2021 (Rp 5,088bn) and FY2022 (Rp 5,870bn) consolidated the AnterAja express-parcel business; AnterAja was deconsolidated into an associate from 2023, so FY2023–FY2024 revenue (Rp ~4.4–5.0tn) is not directly comparable to the FY2021–FY2022 headline.
Fleet-vehicle capex is presented by ASSA inside operating cash flow ('Purchases of fixed assets - leased vehicles'); non-fleet capex sits in investing activities ('Acquisition of fixed assets and advances'). Both lines are shown under Cash Flow.
Quarterly income figures are single quarters derived by year-to-date differencing of the interim statements (Q4 FY24 = full-year audited minus 9M YTD); linked figures open the cited page with the printed YTD row highlighted. Quarterly balance-sheet figures are point-in-time as printed.
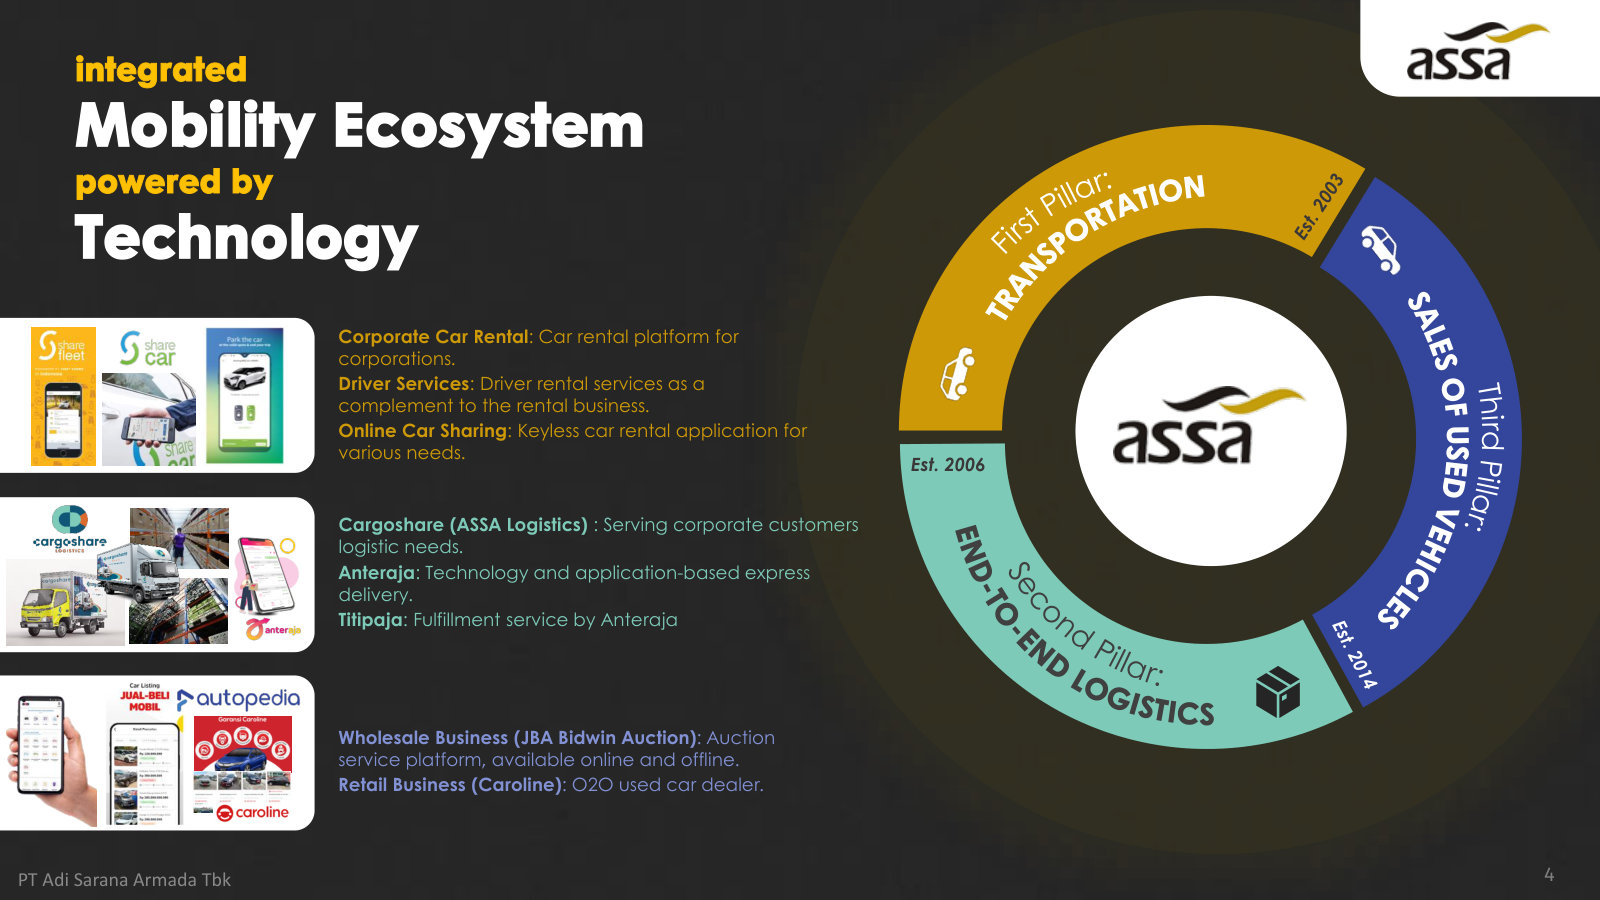
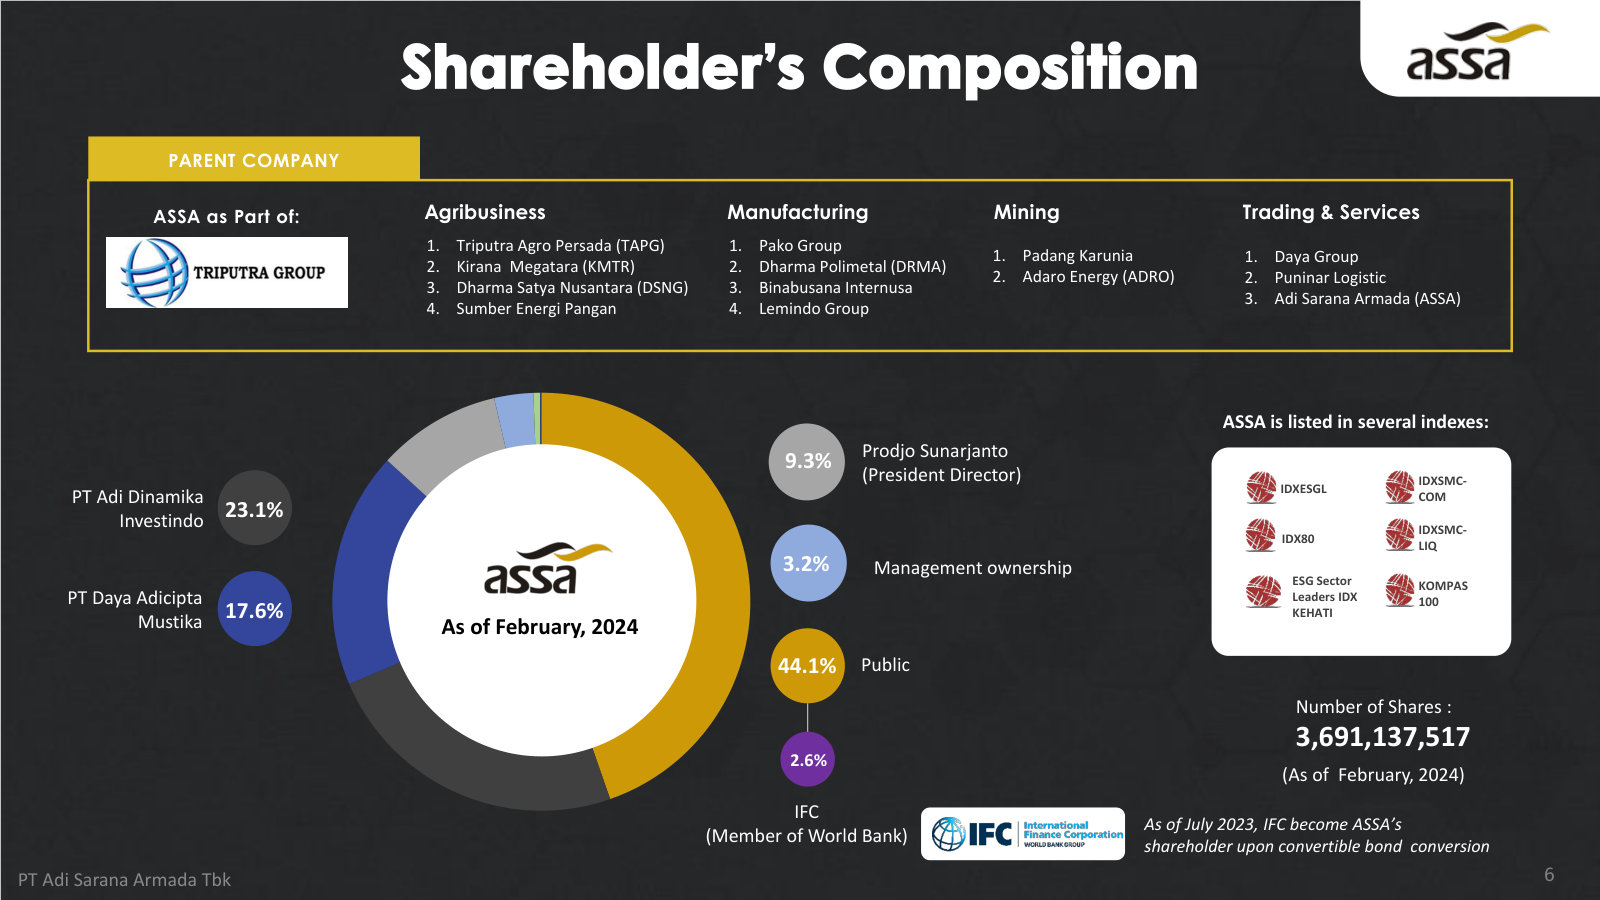
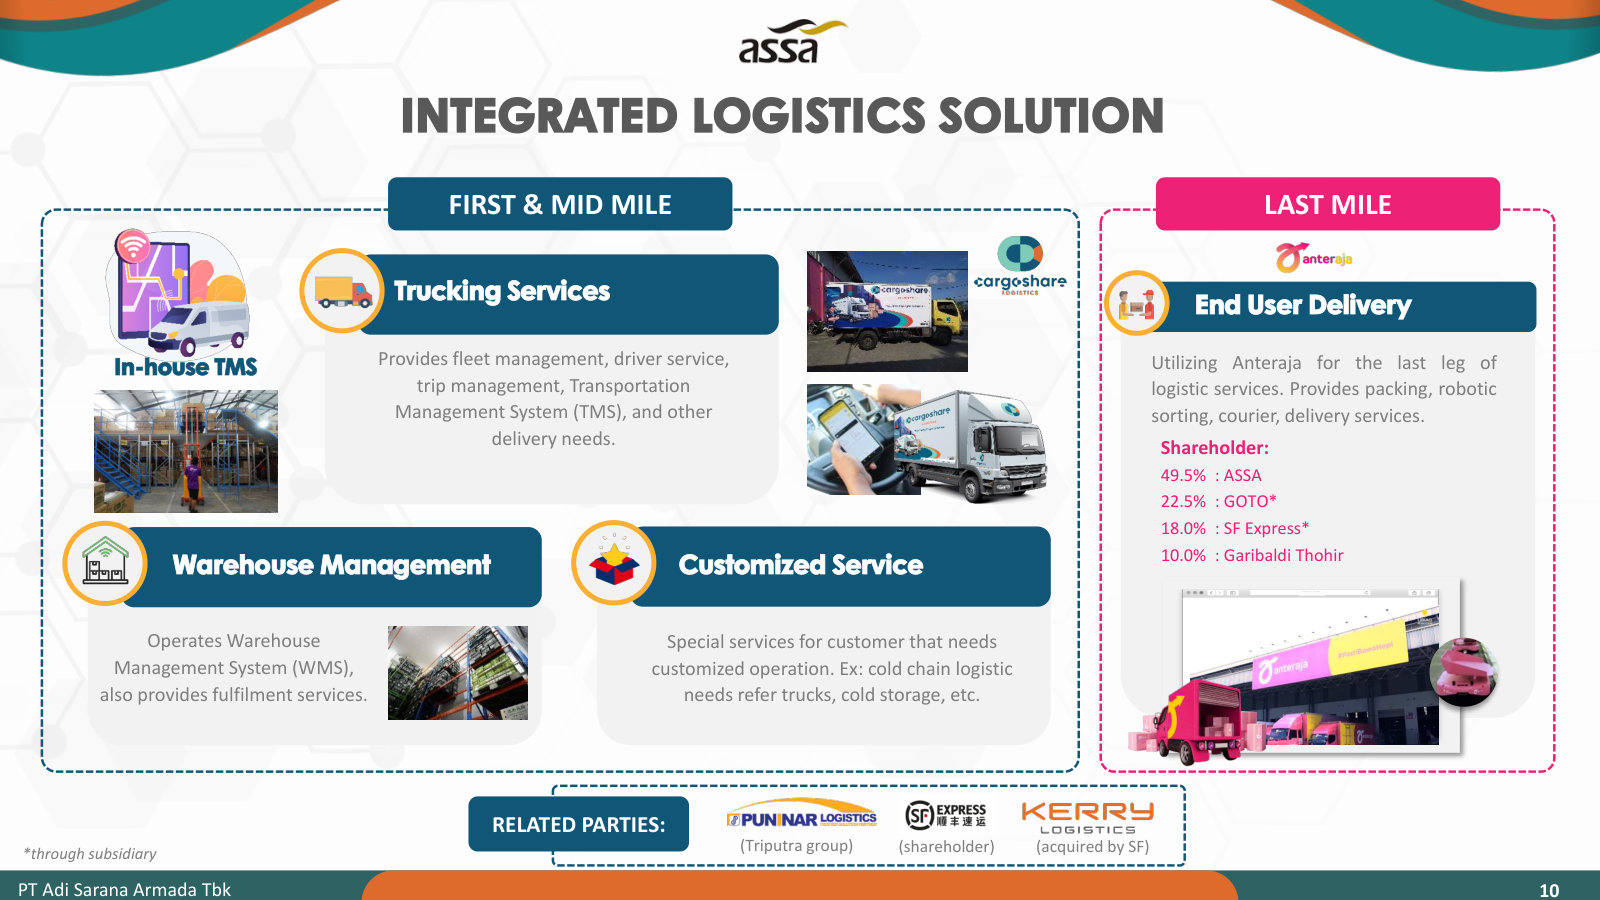
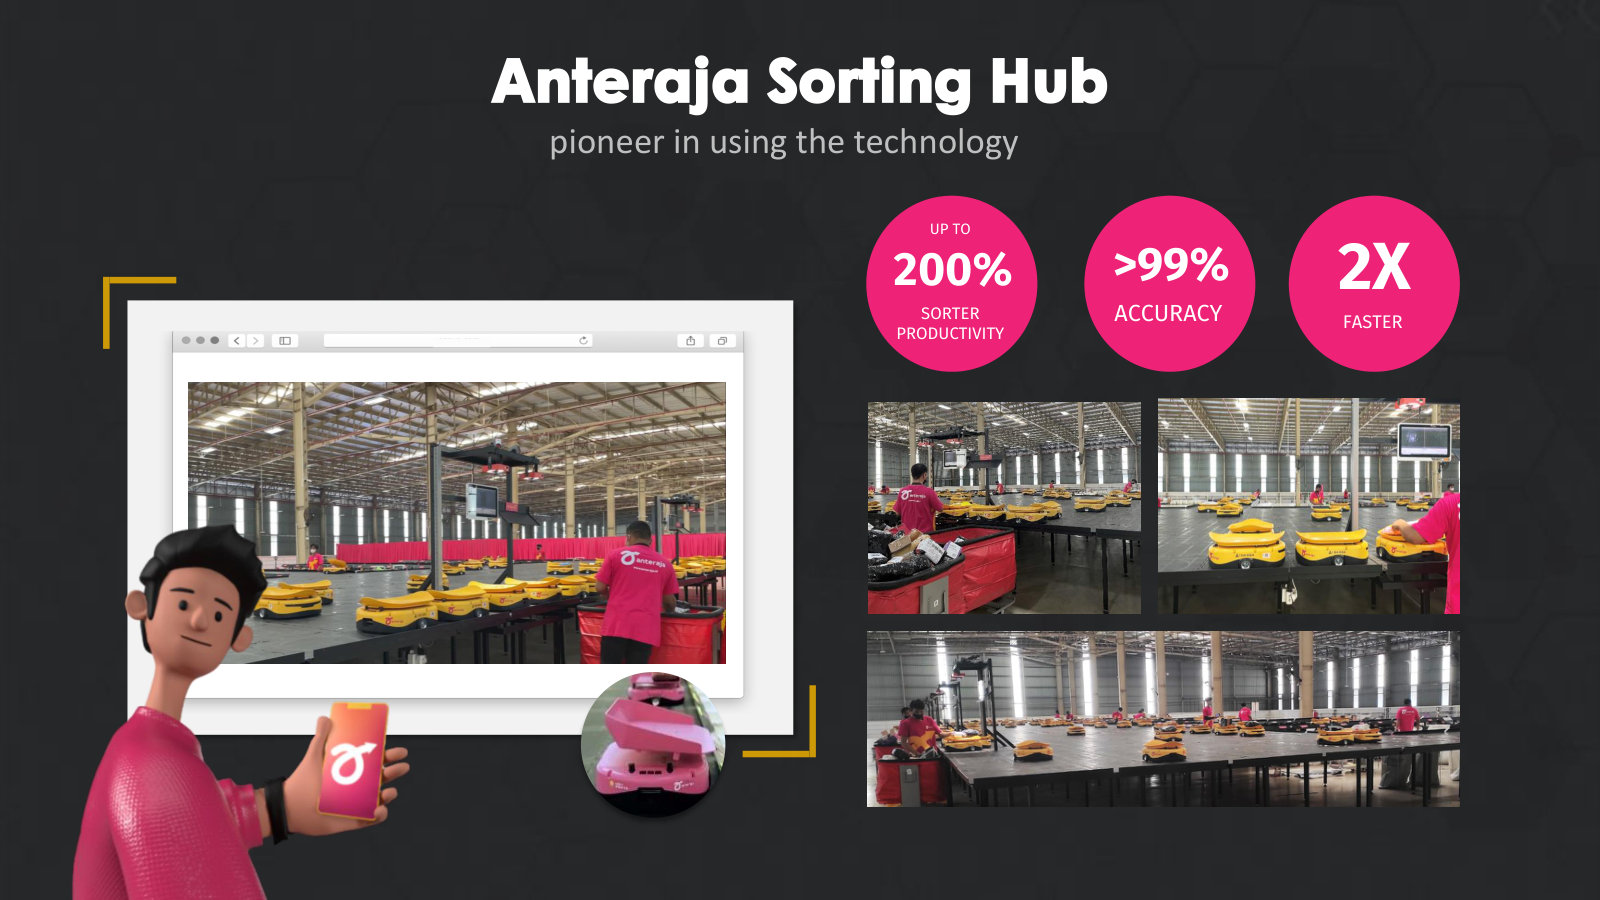
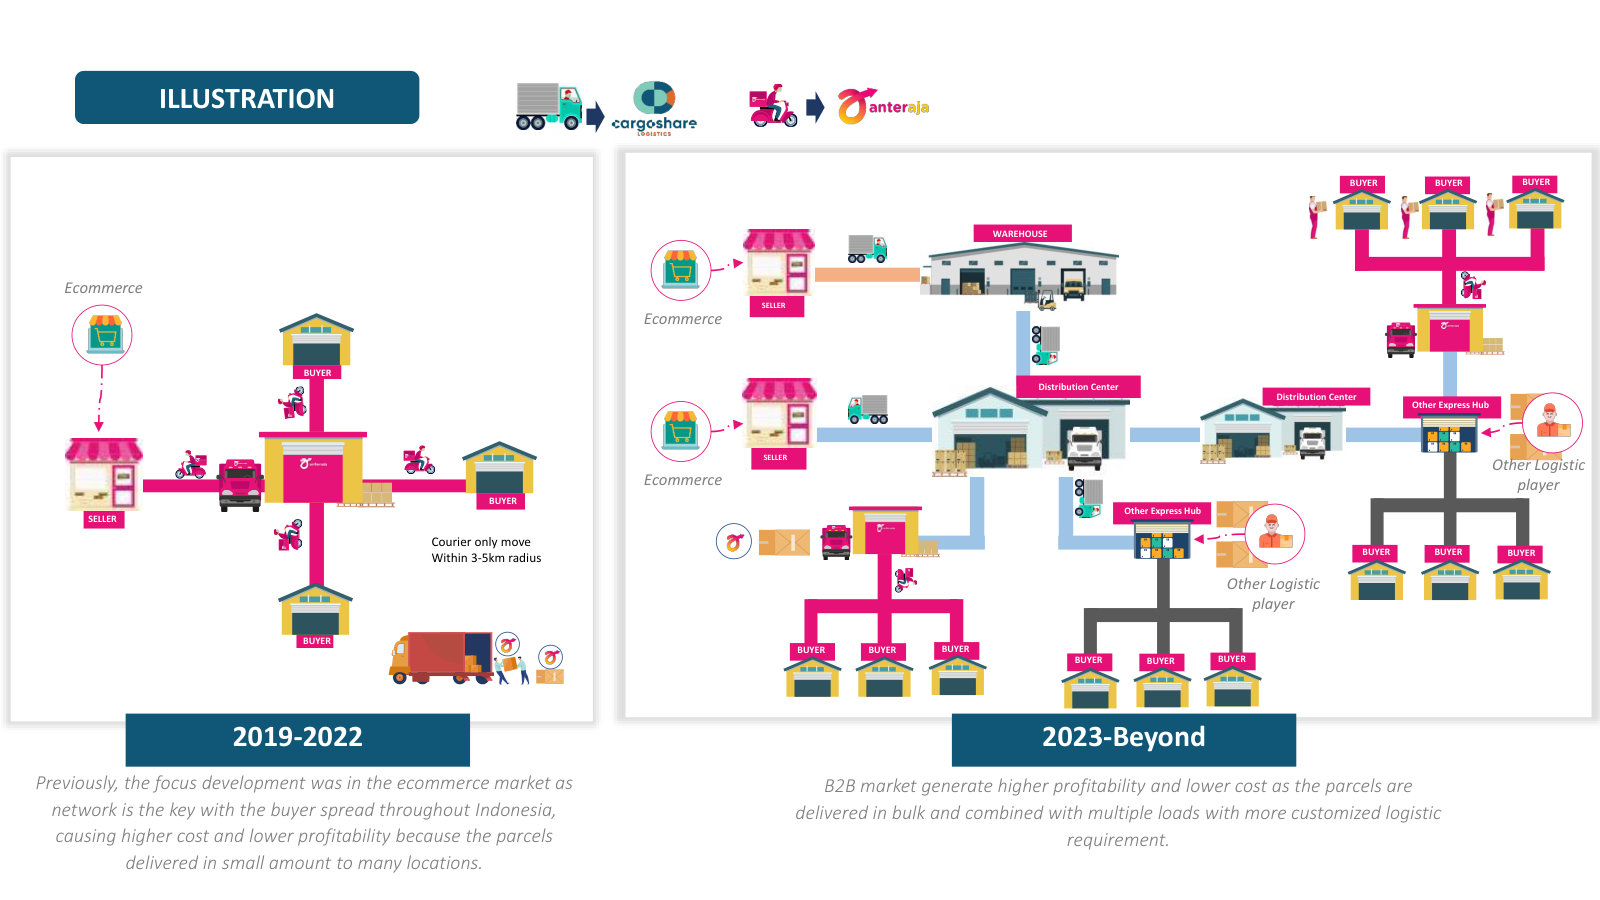
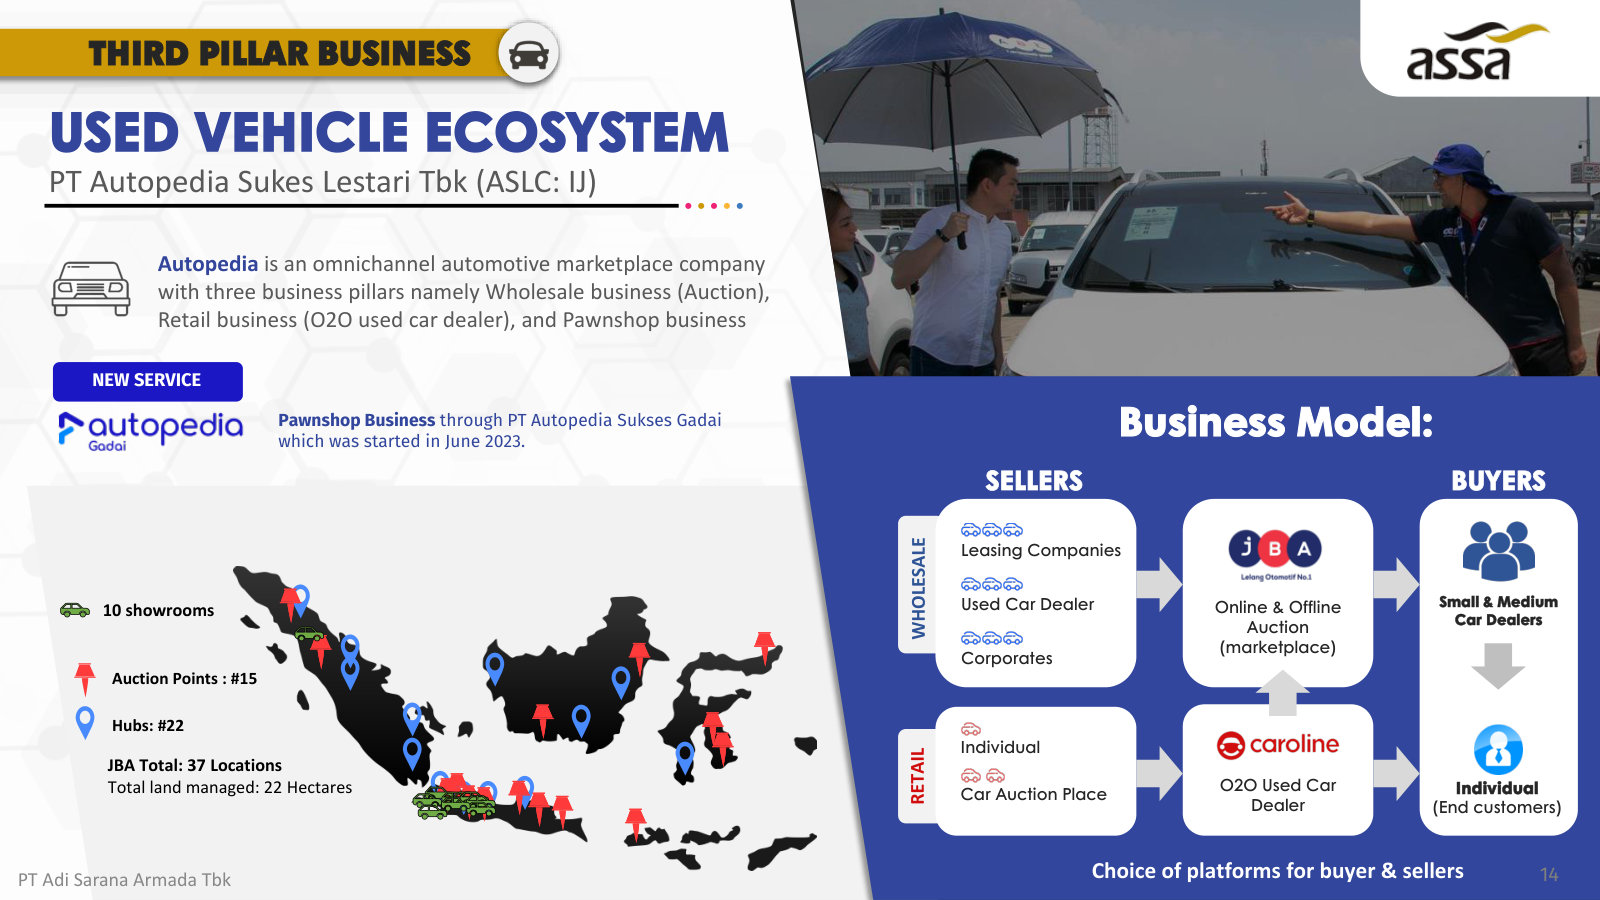
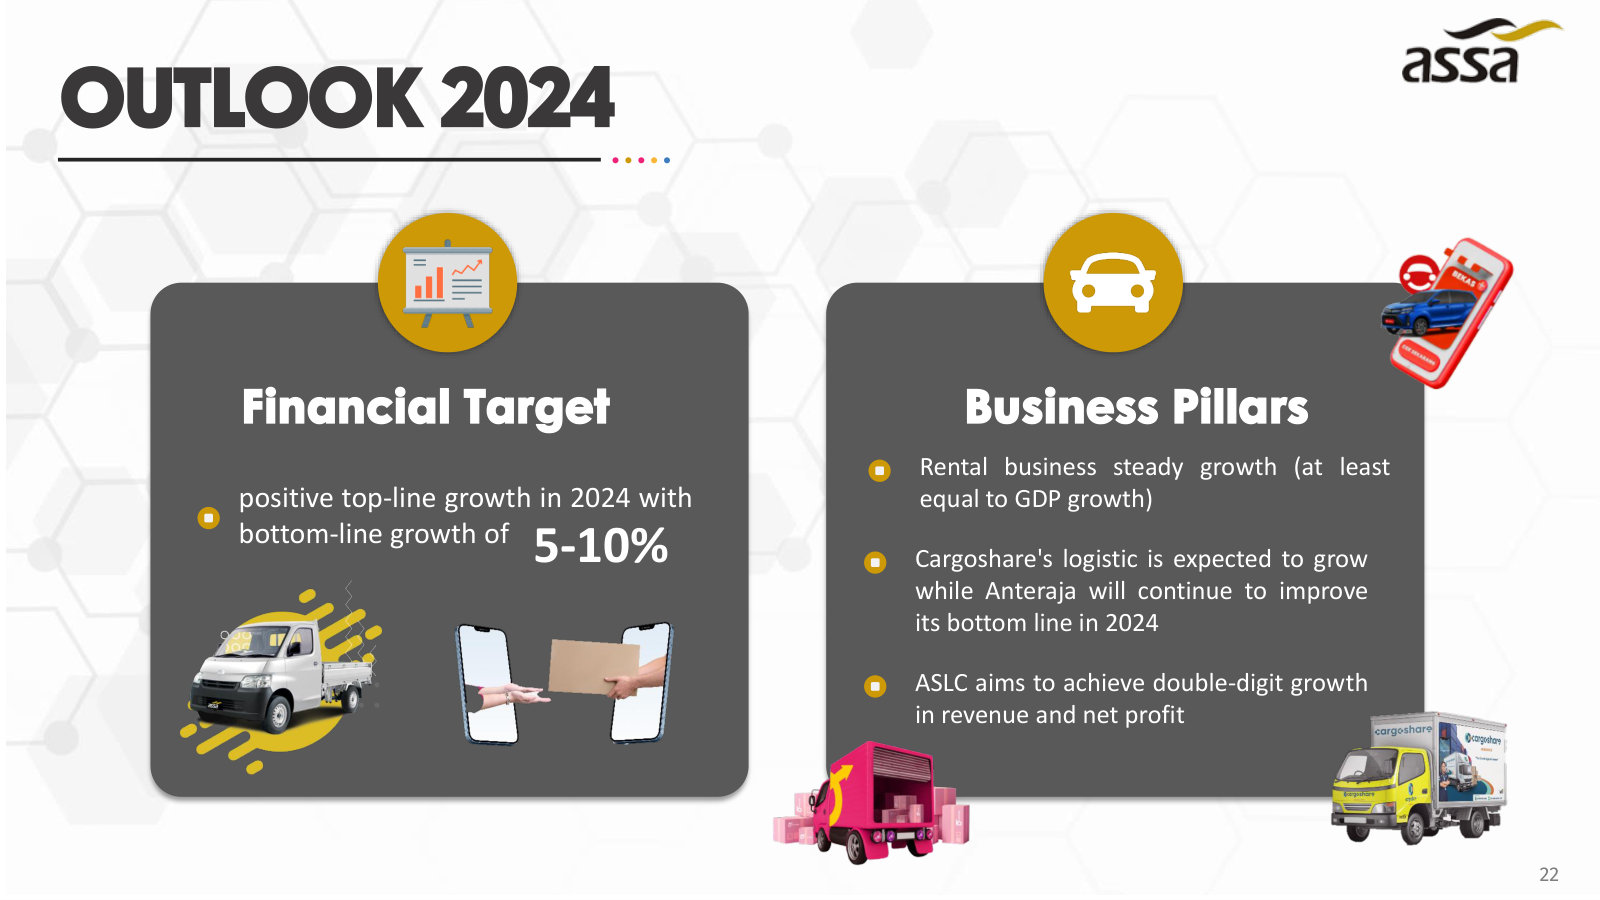
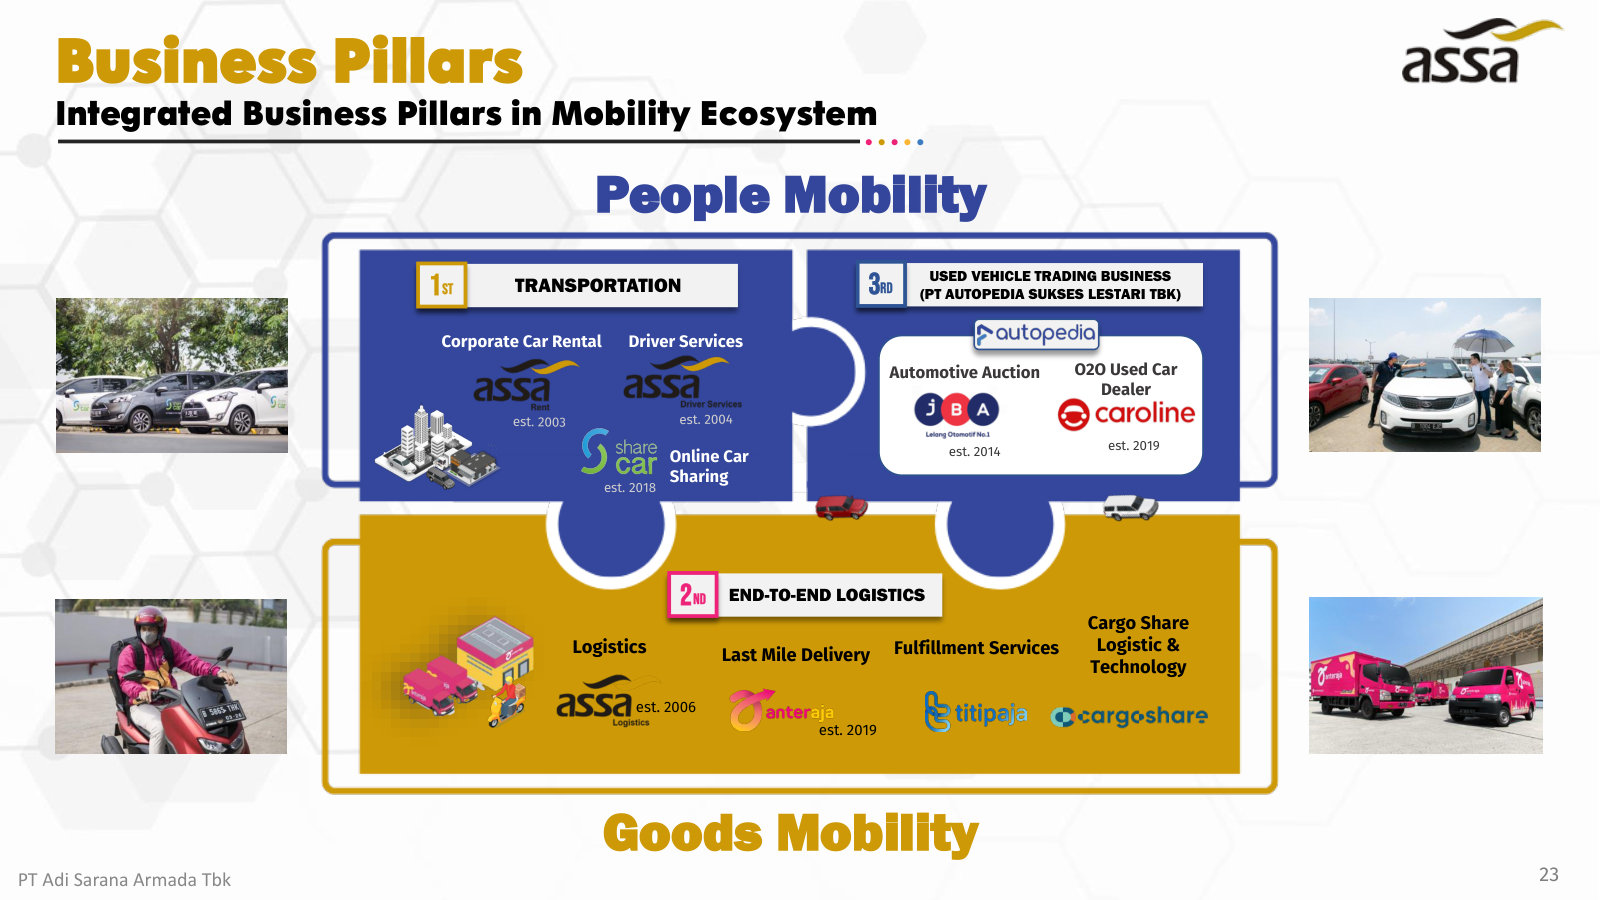
PT Adi Sarana Armada Tbk's management explains the business in its own materials. The slides below do the most of that work, pulled from the documents preserved in Sources. Each source link opens the complete presentation at that slide in a new tab.
Company Overview — Samuel Sekuritas Webinar — Apr 2024
ASSA's own overview deck: the fullest current walk through the three pillars, financials, ESG and 2024 targets. · Open the full document →
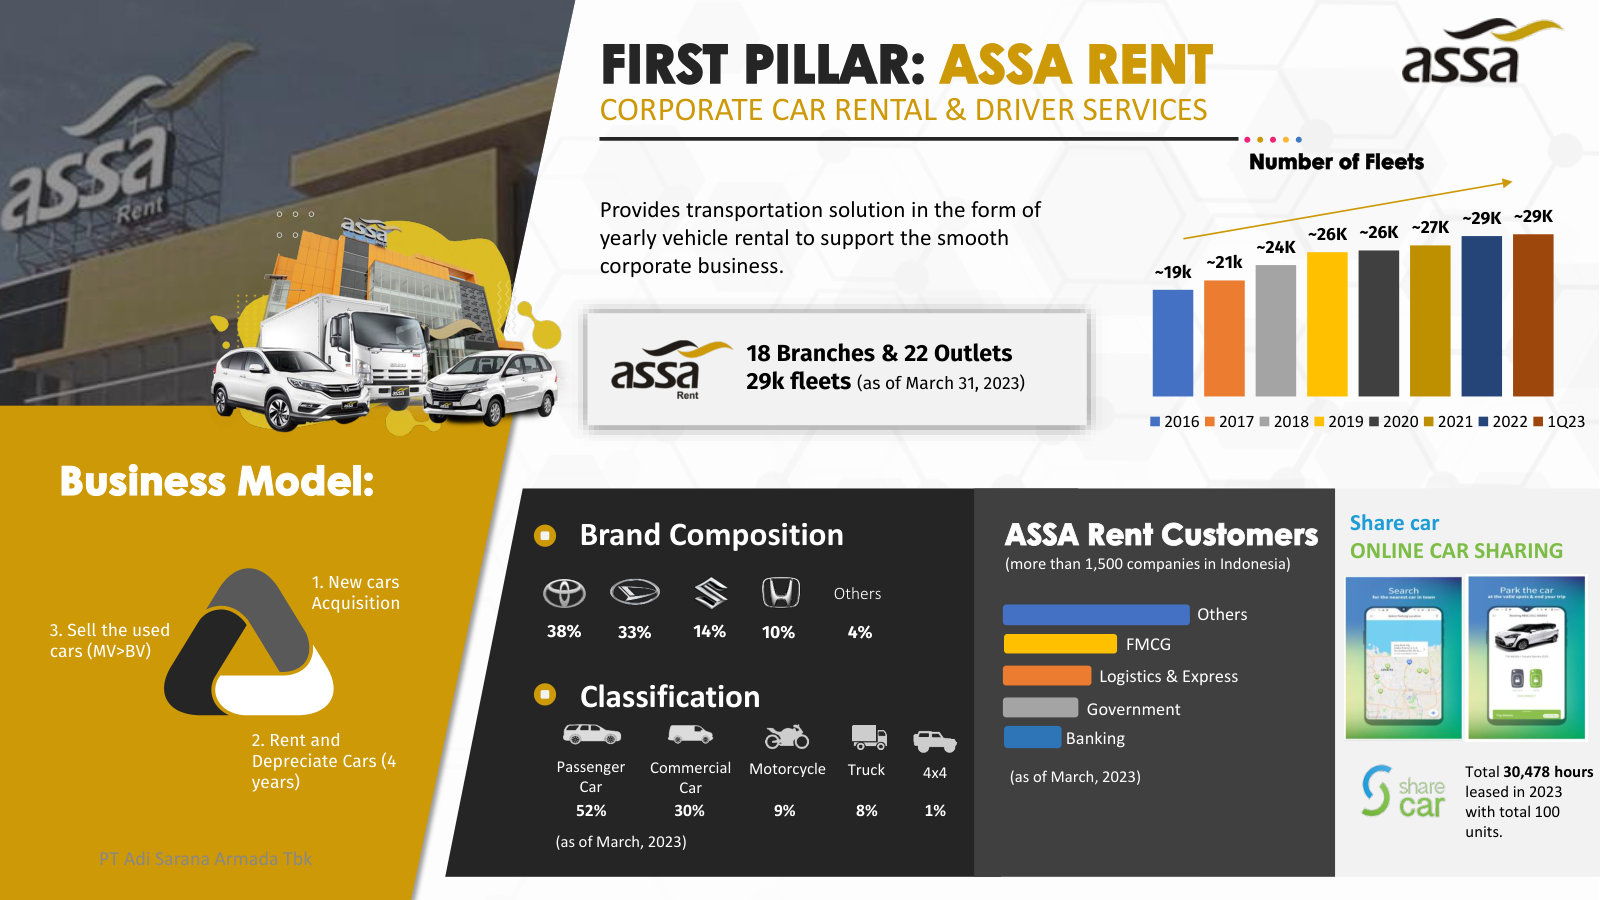
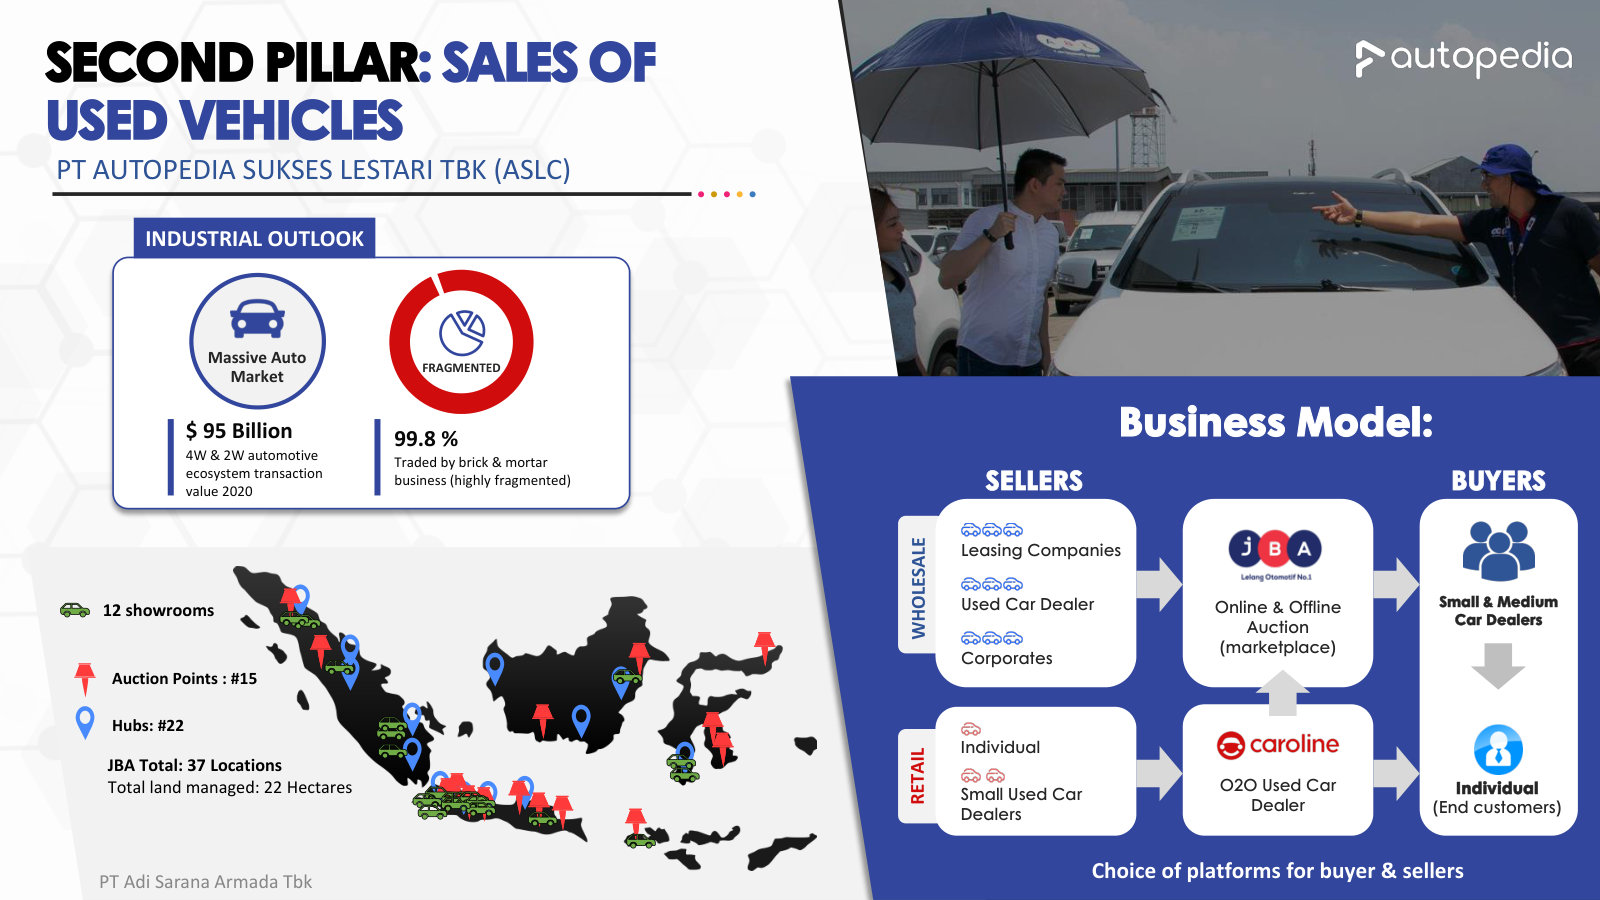
1Q23 Earnings Presentation — 1Q23
Featured only for slides the newer deck lacks: the rental brand/customer mix, the used-car market structure, and segment-level P&L history. · Open the full document →
Competitors describe PT Adi Sarana Armada Tbk's market in their own filings and calls. These verified passages and visual pages show where their strategies meet, using source documents preserved in Sources.
PT Astra International Tbk (ASII)
Astra is a conglomerate, but its Automotive & Mobility arm — Serasi Autoraya (SERA), whose TRAC brand is Indonesia's largest corporate vehicle-rental fleet — is ASSA Rent's single most direct competitor, and its OLXmobbi used-car business competes with ASSA's JBA auctions and Caroline.id. Only the vehicle-rental, used-car and logistics disclosures are used here. Astra's quarterly result decks quantify SERA's fleet under contract and OLXmobbi's used-car volumes — a rival's own numbers on the two markets ASSA competes in.
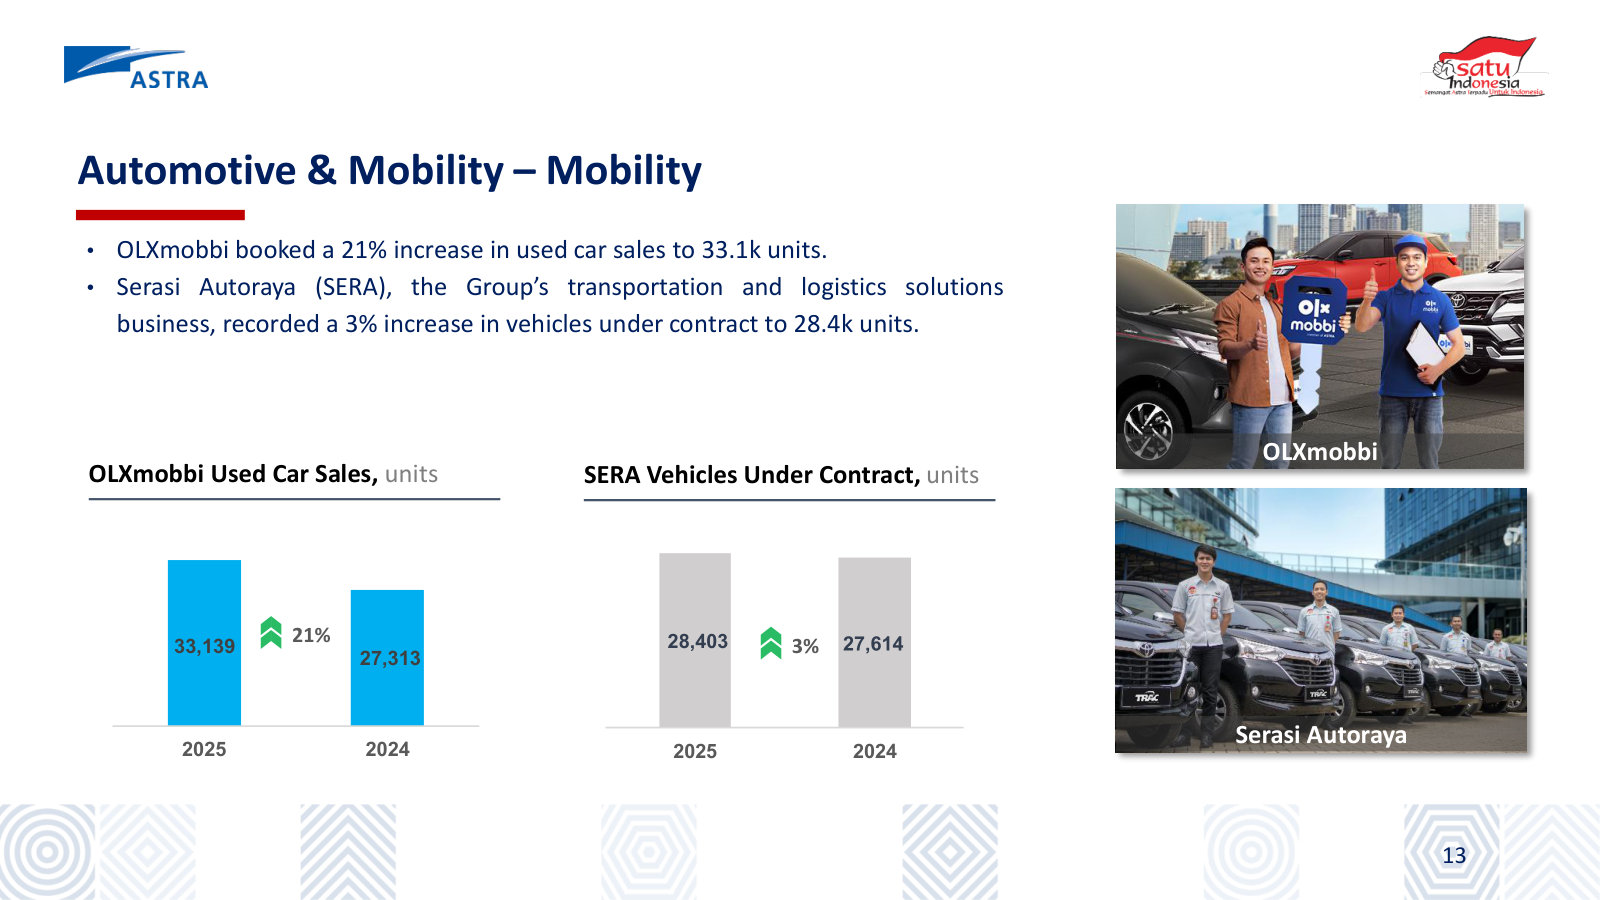
Astra's own scoping of its Mobility unit — SERA framed as 'transportation logistics solutions' and OLXmobbi as 'used car' — the two lines that map directly onto ASSA's fleet-rental/logistics and used-vehicle businesses.
Mobility includes SERA (transportation logistics solutions) and OLXmobbi (used car)
p. 4 · Read in context →
Astra's April 2025 US$120m Toyota (TMA) joint venture into OLXmobbi to 'modernise the used car market' across Indonesia — a well-capitalised push into online-to-offline used cars, the space ASSA's JBA auctions and Caroline.id occupy.
Toyota Motor Asia (Singapore) Pte. Ltd. (TMA) invested USD120 million (approximately Rp2.0 trillion) for a 40% stake in Astra Digital Mobil (ADMO), which owns OLXmobbi, an online-to-offline used car business. […] This collaboration strengthens the longstanding partnership between Astra and TMA, and aims to modernise the used car market and enhance customer access to high-quality vehicles, financing, insurance and aftersales services across Indonesia.
p. 5 · Read in context →
PT Blue Bird Tbk (BIRD)
Indonesia's largest taxi operator, but its portfolio overlaps ASSA's almost line-for-line: corporate/vehicle rental (Golden Bird), bus charter, in-city logistics (Bluebird Kirim), an auction house and used-car trading. It competes head-to-head with ASSA Rent for corporate fleet contracts and with ASSA's logistics, JBA auction and Caroline.id lines. Its annual reports quantify fleet size and the growth of the non-taxi (rental/logistics) segment where the overlap with ASSA is greatest.
Blue Bird's description of its Golden Bird vehicle-rental business — long-term contract rentals to corporate customers, with or without drivers — a near-identical offering to ASSA Rent's core corporate fleet-leasing and driver-services product.
under the “Goldenbird” brand, designed to meet the needs of both individual and corporate customers. The services include short-term rentals, such as airport transfers, hourly rentals, daily (charter) services, and out-of-town trips, as well as longterm contract rentals. […] Meanwhile, long-term contract rental services are primarily ofered to corporate customers and are available with or without drivers.
p. 80 · Read in context →
Blue Bird's stated total fleet of ~26,000 units at end-2025 (+7.7% year-on-year) across taxi and non-taxi segments — a scale benchmark for ASSA's rental fleet, with the non-taxi portion covering ASSA's competitive turf.
the Company recorded an addition of approximately 1,900 fleet units in 2025, growing by 7.7% to a total of 26 thousand units across all of the Company’s service types, both in the taxi and non-taxi segments.
p. 104 · Read in context →
Blue Bird's stated service portfolio — car rental, bus rental, logistics, an auction house and used-car trading — mapping one-for-one onto ASSA's rental, logistics, JBA auction and Caroline.id used-car businesses.
Bluebird has various types of services, such as taxis (regular and executive), car rental, bus rental, intercity shuttle, logistics, auction house, used car trading services, as well as vehicle maintenance services.
p. 75 · Read in context →
PT WEHA Transportasi Indonesia Tbk (WEHA)
A smaller Indonesian land-transport operator (formerly Panorama Transportasi) in vehicle and bus rental, corporate transport, intercity shuttle and courier delivery. It competes with ASSA for corporate rental contracts and driver-based transport, and its filings show how a regional rival frames the same price-competitive Indonesian transport market. Useful as a challenger's read on the market ASSA leads.
WEHA's description of its fleet (400+ vehicles), driver base (400+ trained drivers) and geographic footprint (Jabodetabek, Java, Palembang, Bali) at end-2024 — a regional-scale rival to ASSA in corporate transport and driver services.
Supported by more than 400 trained drivers and more than 400 fleets consisting of various types, types and brands by the end o December 2024, WEHA Group is always committed to providing the best service for loyal customers from various market segments in the Jabodetabek, Java, Palembang area and Bali.
p. 31 · Read in context →
WEHA's stated focus on serving domestic, international and multinational corporate customers with its bus-rental brand — the same corporate-client segment ASSA targets in fleet leasing and employee transport.
focus on operating bus rental business activities under the brand name “White Horse Deluxe Coach” (WHDC) to serve domestic and international corporate customers and multinational companies in Jakarta and Sumatra.
p. 60 · Read in context →
WEHA's characterisation of the Indonesian transport market as open but price-competitive, requiring cost efficiency to compete — the same competitive dynamic that shapes ASSA's rental pricing.
the Company remains optimistic seeing the market potential that is still very open, and the Company must continue to make efficiency on costs in order to compete in facing competition in this transportation industry.
p. 73 · Read in context →
Avis Budget Group, Inc. (CAR)
Not an Indonesian rival, but the clearest large-cap business-model comparable for ASSA's core operation: global vehicle rental, fleet management, car sharing (Zipcar) and used-vehicle remarketing. Its 10-K sizes the global rental market, sets out how the industry competes, and details the buy-hold-resell fleet economics and auction disposition channels that also drive ASSA's rental margins and used-car (JBA/Caroline.id) business.
Avis's overview of the global vehicle-rental and car-sharing model ASSA also runs — car, truck and car-sharing brands operating in ~180 countries with an average global rental fleet of ~684,000 vehicles in 2025.
We are a leading global provider of mobility solutions through our three most recognized brands, Avis, Budget and Zipcar, as well as several other brands, well recognized in their respective markets. Our brands offer a range of options, from car and truck rental to car sharing. We license the use of the Avis, Budget, Zipcar and other brands’ trademarks to licensees in areas in which we do not operate directly. We and our licensees operate our brands in approximately 180 countries throughout the world. […] On average, our global rental fleet totaled approximately 684,000 vehicles in 2025.
p. 9 · Read in context →
Avis's formal 'Competition' section — the vehicle-rental industry competes primarily on price, service quality, booking usability, vehicle availability and condition, and rental locations — the same dimensions on which ASSA competes in Indonesian corporate rental.
The competitive environment for our industry is generally characterized by intense price and service competition among global, local and regional competitors. Competition in our vehicle rental operations is based primarily upon price; customer service quality, including usability of booking systems and ease of rental and return; vehicle availability; vehicle condition, age and mileage; rental locations; product innovation and national or international distribution.
p. 21 · Read in context →
Avis on fleet cost as its single largest expense and the used-vehicle channels — traditional and online auctions — it uses to remarket rental cars, the same buy-hold-resell cycle and auction disposition that underpin ASSA's fleet economics and JBA/Caroline.id used-car business.
Fleet costs typically represent our single largest expense and can vary from year to year based on the prices that we are able to purchase and dispose of our vehicles. […] In 2025, on average approximately 84% of our rental fleet was comprised of risk vehicles. […] We currently sell risk vehicles through various sales channels in the used vehicle marketplace, including traditional auctions, and alternative disposition channels, including online auctions
p. 28 · Read in context →
More peer documents
Q1_FY2026 — 26 pages · Latest quarterly deck — SERA vehicles under contract of 28,786 (up from 25,339 a year earlier) and OLXmobbi used-car sales, extending the fleet/used-car trajectory that tracks ASSA's two core markets. · Open →
Q3_FY2025 — 31 pages · 9M25 interim SERA fleet (26,521) and OLXmobbi (23,885) datapoints, plus the Mega Manunggal Property acquisition — Astra's move into industrial & logistics warehousing adjacent to ASSA's logistics arm. · Open →
BIRD_annual_report_FY2024 — 430 pages · FY2024 report with Blue Bird's largest-licensed-taxi market-share claim and 540+ exclusive pick-up locations, plus the FY2024 Golden Bird rental and Caready auction descriptions — its distribution moat in the shared Indonesian mobility market and a year-earlier baseline to the featured FY2025 exhibits. · Open →
WEHA_annual_report_FY2023 — 203 pages · Prior-year WEHA report ('more than 300 drivers and more than 300 fleets') showing the fleet grew to 400+ by FY2024 — a two-year read on a regional rival's expansion and its DayTrans Express courier line that overlaps ASSA's AnterAja. · Open →
CAR_annual_report_FY2024 — 167 pages · Prior-year Avis 10-K with the same 'Competition' section and program-vs-risk fleet-economics detail — a year-over-year check on how the model comparable characterises the vehicle-rental market and used-car residual-value risk. · Open →
Q4_FY2025 — 10 pages · Avis full-year earnings call with management commentary on per-unit fleet cost and used-vehicle residual values — a current read on the fleet-cost cycle common to all vehicle-rental operators including ASSA. · Open →
Q3_FY2025 — 10 pages · Avis Q3 earnings call discussing fleet, residual/used-car values and per-unit fleet cost — the quarter-by-quarter read on the residual-value cycle that drives fleet-owning rental margins. · Open →
Source: S&P Capital IQ consensus via Xpressfeed · Generated 2026-07-17.
Street snapshot
Coverage is uniformly positive but thin: two buy ratings and one outperform, with no holds or sells, for a consensus recommendation score of 1.33. The two target prices average IDR 1,335 (median 1,335) and span 1,070 to 1,600.
Currency: IDR · Scale: money in millions, billions, absolute (per share) · Analyst counts shown explicitly; recommendation respondents: 3.
| Street view | Reading | Analysts |
|---|---|---|
| Recommendation mix | Buy 2, Outperform 1, Hold 0, Underperform 0, Sell 0 | 3 |
| Consensus score | 1.33 | 3 |
| Target price | mean 1,335; high 1,600; low 1,070 | 2 |
Forward table
Coverage is deepest for FY2025 (three estimates on the core lines) and thins to a single estimate per metric from FY2026 onward, with no quarterly coverage.
Currency: IDR · Scale: money in millions, billions, absolute (per share) · Analyst count is the estimate count for each period and metric.
| Period | Metric | Mean | YoY | Analysts | Low / high |
|---|---|---|---|---|---|
| FY0E | Revenue | 6,546 | 9.3% | 1 | 6,546 / 6,546 |
| FY0E | EBITDA | 1,264 | -29.8% | 1 | 1,264 / 1,264 |
| FY0E | EBIT | 1,093 | 6.3% | — | — / — |
| FY0E | Net income (GAAP) | 470.0 | 12.5% | 1 | 470.0 / 470.0 |
| FY0E | Net income (normalized) | 470.0 | 6.3% | — | — / — |
| FY0E | EPS (GAAP) | 132.1 | 16.8% | 1 | 132.1 / 132.1 |
| FY0E | EPS (normalized) | 132.1 | 16.8% | 1 | 132.1 / 132.1 |
| FY0E | Free cash flow | 405,000 | -6.7% | — | — / — |
| FY0E | Gross margin | 33.5% | 6.3% | — | — / — |
| FY0E | Capital expenditure | -445.0 | 7.7% | — | — / — |
| FY0E | Net debt | 3,112 | -13.6% | — | — / — |
| FY0E | ROE | 19.4% | -1.9% | — | — / — |
| FY0E | Cash from operations | 850.0 | -2.9% | — | — / — |
| FY+1E | Revenue | 7,175 | 9.6% | 1 | 7,175 / 7,175 |
| FY+1E | EBITDA | 1,393 | 10.2% | 1 | 1,393 / 1,393 |
| FY+1E | EBIT | 1,213 | 11.0% | — | — / — |
| FY+1E | Net income (GAAP) | 533.0 | 13.4% | 1 | 533.0 / 533.0 |
| FY+1E | Net income (normalized) | 533.0 | 13.4% | — | — / — |
| FY+1E | EPS (GAAP) | 149.9 | 13.4% | 1 | 149.9 / 149.9 |
| FY+1E | EPS (normalized) | 149.9 | 13.4% | 1 | 149.9 / 149.9 |
| FY+1E | Free cash flow | 380,000 | -6.2% | — | — / — |
| FY+1E | Gross margin | 34.2% | 2.1% | — | — / — |
| FY+1E | Capital expenditure | -445.0 | 0.0% | — | — / — |
| FY+1E | Net debt | 3,129 | 0.5% | — | — / — |
| FY+1E | ROE | 18.2% | -6.2% | — | — / — |
| FY+1E | Cash from operations | 824.0 | -3.1% | — | — / — |
| FY+2E | Revenue | 7,846 | 9.4% | 1 | 7,846 / 7,846 |
| FY+2E | EBITDA | 1,529 | 9.8% | 1 | 1,529 / 1,529 |
| FY+2E | EBIT | 1,340 | 10.5% | — | — / — |
| FY+2E | Net income (GAAP) | 596.0 | 11.8% | 1 | 596.0 / 596.0 |
| FY+2E | Net income (normalized) | 596.0 | 11.8% | — | — / — |
| FY+2E | EPS (GAAP) | 167.6 | 11.8% | 1 | 167.6 / 167.6 |
| FY+2E | EPS (normalized) | 167.6 | 11.8% | 1 | 167.6 / 167.6 |
| FY+2E | Free cash flow | 543,000 | 42.9% | — | — / — |
| FY+2E | Gross margin | 34.9% | 2.0% | — | — / — |
| FY+2E | Capital expenditure | -445.0 | 0.0% | — | — / — |
| FY+2E | Net debt | 3,022 | -3.4% | — | — / — |
| FY+2E | ROE | 17.1% | -6.0% | — | — / — |
| FY+2E | Cash from operations | 988.0 | 19.9% | — | — / — |
Estimate momentum
The clearest shift is a downward revision to FY2027 normalized EPS, marked to 149.9 from roughly 158.8 six months ago and 159.9 a month ago, while FY2027 revenue held near 7,175 (from 7,144). It reads as a single-year EPS cut rather than a broad revision, and rests on one estimate.
Currency: IDR · Scale: money in millions, billions, absolute (per share) · Point-in-time consensus; analyst count is shown where supplied.
| Period | Metric | Lookback | Then | Now | Direction / magnitude | Analysts |
|---|---|---|---|---|---|---|
| 2027 | Revenue | 30d | 7,110 | 7,175 | up 0.9% | — |
| 2027 | Revenue | 90d | 7,144 | 7,175 | up 0.4% | — |
| 2027 | Revenue | 180d | 7,144 | 7,175 | up 0.4% | — |
| 2028 | Revenue | 30d | 7,846 | 7,846 | flat 0.0% | — |
| 2027 | EPS (normalized) | 30d | 159.9 | 149.9 | down 6.3% | — |
| 2027 | EPS (normalized) | 90d | 158.8 | 149.9 | down 5.6% | — |
| 2027 | EPS (normalized) | 180d | 158.8 | 149.9 | down 5.6% | — |
| 2028 | EPS (normalized) | 30d | 167.6 | 167.6 | flat 0.0% | — |
Beat / miss record
No comparable reported quarters.
Currency: IDR · Scale: money in millions, billions, absolute (per share) · Consensus is captured before each actual first became effective; analyst count shown per observation.
| Quarter | Metric | Consensus as of | Actual | Surprise | Outcome | Analysts |
|---|---|---|---|---|---|---|
| — | No beat/miss observations | — | — | — | — | — |
Where the street disagrees
Disagreement is confined to FY2025, the only year carrying multiple estimates: EBITDA shows the widest band at IDR 1,264-1,937bn (stddev ~304) against a tighter revenue range of 5,578-6,020bn. From FY2026 the single-estimate coverage leaves zero spread, which reflects thin coverage rather than genuine agreement.
Currency: IDR · Scale: money in millions, billions, absolute (per share) · Dispersion is high-low divided by absolute mean; analyst count shown per item.
| Period | Metric | Mean | Low | High | Spread / mean | Analysts |
|---|---|---|---|---|---|---|
| 2025 | EBITDA | 1,692 | 1,264 | 1,937 | 39.8% | 3 |
| 2025 | EPS (normalized) | 118.2 | 112.3 | 125.1 | 10.8% | 3 |
| 2025 | EPS (GAAP) | 118.2 | 112.3 | 125.1 | 10.8% | 3 |
| 2025 | Net income (GAAP) | 442.3 | 417.0 | 461.0 | 9.9% | 3 |
| 2025 | Revenue | 5,849 | 5,578 | 6,020 | 7.6% | 3 |
PT Adi Sarana Armada (IDX: ASSA) is an Indonesian corporate-mobility and logistics group whose profit is at a record and whose shares are not. Operating profit for the nine months to September 2025 rose 49% year-on-year and net profit to owners 64%, yet the stock trades near Rp635 — roughly 84% below its October 2021 peak and about 47% lower across 2026 alone. The report examines whether that gap is opportunity or a warranted discount for a leveraged, asset-heavy balance sheet.
What ASSA is
ASSA began in 1999 as a corporate vehicle-rental company and now runs three connected businesses: fleet rental and driver services; end-to-end logistics — the Anteraja last-mile courier plus the CargoShare B2B transport arm; and a used-vehicle ecosystem of JBA auctions and the Caroline retail marketplace [1]. The used-vehicle arm is run through ASSA's separately listed subsidiary, Autopedia Sukses Lestari. The rental fleet numbered roughly 30,000 vehicles at the end of 2023 [2]. The company listed on the Indonesia Stock Exchange in November 2012.
Two facts about who controls it matter to how the rest of this report reads. ASSA sits inside the Triputra Group, the industrial holding built by Theodore Permadi (T.P.) Rachmat — a co-founder of Adaro Energy and former chief executive of Astra International — alongside listed names such as Dharma Polimetal and Triputra Agro Persada [3]. Triputra-affiliated vehicles hold a controlling block; the founding president director, Prodjo Sunarjanto, has led the company since the 2012 listing and personally holds about 3.2%, and the International Finance Corporation (the World Bank's private-sector arm) holds roughly 2.6% following a 2023 convertible-bond conversion [3]. This is a promoter-backed, founder-run company rather than a widely held one.
How big it is, and how it makes money
Revenue reached Rp4.96tn in FY2024, up 11.7% from Rp4.44tn in FY2023, and Rp4.41tn in the first nine months of 2025, up 21.2% year-on-year [3] [4]. The three pillars are complementary: fleet rental supplies steady, contracted cash flows from blue-chip corporate clients; logistics adds volume and reach; and the used-vehicle arm monetises fleet vehicles at the end of their rental life. Company disclosure around the first quarter of 2025 put logistics at roughly 42% of quarterly revenue, so this is no longer only a rental business [5].
Sources: FY2024 audited statements [6]; 9M2025 statements [7]; FY2025E is consensus, not reported.
The earnings recovery
The recovery is the reason ASSA is worth a professional investor's time. FY2023 was a trough: operating profit was Rp326bn and total group profit for the year just Rp19.4bn [8], with net profit to owners of Rp103.8bn [9] — the difference reflecting losses absorbed by minority shareholders in the group's loss-making units. FY2024 then more than doubled operating profit to Rp705bn [10] and lifted net profit to owners to Rp243.7bn [11].
Momentum continued into 2025. For the nine months to September, operating profit was Rp814bn (up 49%) and net profit to owners Rp348.6bn (up 64%), taking nine-month basic earnings per share to Rp94.44 from Rp57.26 [12] [13]. For the full year, ASSA reported group net profit up about 81% and its board declared a Rp184.6bn cash dividend — a 44% payout, or Rp50 per share [14].
Sources: FY2024/FY2023 revenue and operating profit [15] and profit to owners / EPS [16]; 9M2025 statements [17]. 9M2025 figures are nine-month; not comparable to the full-year columns.
The balance sheet, in one paragraph
The counterweight to the earnings story sits on the balance sheet. As of 30 September 2025, total assets were Rp8.38tn, total liabilities Rp5.23tn and total equity Rp3.16tn — of which Rp2.19tn was attributable to ASSA's own shareholders and Rp0.96tn to minority interests in the subsidiaries [18]. Interest-bearing borrowings, including lease liabilities, totalled about Rp4.25tn [19]. A company that owns tens of thousands of vehicles and funds them with bank debt is capital-intensive by design; the size of that debt against roughly Rp2.2tn of owners' equity is the first question a cautious investor will ask, and this report returns to it in a dedicated chapter.
The price, and what it implies
Source: daily price feed, Indonesia Stock Exchange (month-end closes) [20].
The share price and the earnings have moved in opposite directions. ASSA reached an all-time high near Rp4,000 in October 2021, during the pandemic-era enthusiasm for its Anteraja e-commerce logistics arm; at Rp635 it now sits about 84% below that peak. Most of the latest leg down came in 2026: the stock roughly halved from about Rp1,190 in late January to Rp635 in mid-July, even as FY2025 results set records and the dividend was raised. (Peak and current levels are public market data; the reported financials are cited above.)
That leaves a set of undemanding multiples for a business still growing. On 3,691,137,517 shares, ASSA's market value at Rp635 is about Rp2.34tn [21] — roughly 1.1 times the Rp2.19tn of equity attributable to its owners, about 5.6 times FY2025 net profit to owners of some Rp418bn, and a trailing dividend yield near 7.9% [22]. The two sell-side analysts covering the stock carry a mean target of Rp1,335, more than double the current price.
Share Price (Rp)
Market Cap (Rp bn)
Trailing P/E (x)
Price / Owners' Equity (x)
Dividend Yield
From 2021 Peak
Sources: valuation derived from reported financials and the price feed [23] [24]; FY2025 net profit and dividend per news coverage [25]. Multiples on ~Rp418bn FY2025 net profit to owners and 3.69bn shares.
The question this report examines
ASSA has the profile a value or special-situation investor tends to look for: a founder-run, promoter-backed company whose earnings are at a record, trading at about 5 times profit, near book value, on a near-8% yield, and roughly 84% below a former peak. It also carries a leveraged, asset-heavy balance sheet, and the pandemic-era enthusiasm for its courier arm has since reversed. The central question this report examines is whether ASSA — a leveraged, low-return fleet owner wrapped around two partly-owned, asset-light profit engines, trading at roughly book and about 5.6x record earnings after an ~84% fall from its 2021 peak and a further ~47% across 2026 — is a mispriced fallen star, or a fair price for a debt-heavy model whose profits belong substantially to minorities.
Answering it means testing four things the price disconnect turns on: whether the balance sheet is a solvency risk or merely a heavy one; whether the earnings recovery — and the Anteraja turn to profit — is durable or cyclical; how much of the group's profit actually belongs to ASSA's own shareholders rather than to minority partners; and what the promoter's ownership and the group's capital discipline say about who this business is run for. Each is taken up in the chapters that follow.
The numbers behind the recovery
ASSA's profit recovery from FY2023 to FY2025 is real but easy to misread. Group net profit rose roughly 30-fold off a FY2023 trough and then another 81% in FY2025, yet reported revenue actually fell between FY2022 and FY2023. The reconciliation is a margin-and-mix story: ASSA shrank a loss-making express-delivery unit while a profitable rental, logistics and used-vehicle core kept growing. Operating margin more than tripled from 4.6% (FY2022) to 18.4% (9M2025). Two cautions travel with the good news — a chunk of profit belongs to minorities, and Q4 is seasonally the weakest quarter.
Revenue (9M2025)
Operating Profit (9M2025)
Net Profit to Owners (9M2025)
Basic EPS (9M2025, Rp)
Source: 9M2025 consolidated statement of profit or loss [1] and profit attribution [2]. Figures in Rp billion unless noted.
A note on sourcing: the full annual reports for FY2022–FY2024 sit on hosts this environment cannot reach, so the multi-year history here is built from the audited FY2024 consolidated statements (which carry FY2023 comparatives), the 9M2025 interim statements, a FY2022 company investor deck, and, for FY2025 and forward years, the audited FY2025 filing summary and published analyst consensus. Each figure is cited to its own source below.
Revenue: a headline distorted by the express boom and bust
Reported revenue is not a clean growth line. It climbed to Rp5.87tn in FY2022, fell to Rp4.44tn in FY2023, then recovered to Rp4.96tn in FY2024 and about Rp6.0tn in FY2025 [3] [4]. The FY2022 peak was inflated by AnterAja, the last-mile courier business, which the company's own disclosure shows was 54% of FY2022 revenue and a much smaller 32% by FY2023 [5]. Strip out AnterAja and the core business grew steadily — from Rp2.72tn (FY2022) to Rp3.01tn (FY2023) on the company's ex-express basis [6]. The revenue "decline" was the deliberate shrinking of an unprofitable courier operation, not a fading business.
Sources: FY2022 from investor deck [7]; FY2023–FY2024 audited statements [8]; FY2025 (~Rp6.0tn) and FY2026E from analyst consensus [9]. FY2026E is an estimate.
That mix shift set up the profit recovery. In 9M2025 revenue growth returned in earnest — up 21.2% year-on-year to Rp4.41tn (9M2024: Rp3.64tn) — so the story is no longer only about pruning costs; the top line is now growing alongside the margin [10].
Margins: the operating leverage is doing the work
The clearest signal in the accounts is margin expansion. Gross margin rose from 25.1% (FY2023) to 30.4% (FY2024) to 31.6% (9M2025). Operating margin roughly doubled at each step — 7.3% to 14.2% to 18.4% — as revenue grew faster than a largely fixed cost base and the express drag receded [11] [12].
Source: derived from reported revenue, gross profit, operating profit and net profit to owners, FY2023–FY2024 audited statements and 9M2025 interim statements [13] [14].
Operating profit tells the same story in absolute terms: Rp268bn (FY2022), Rp326bn (FY2023), Rp705bn (FY2024), and Rp814bn in nine months of FY2025 alone — already above the full-year FY2024 figure [15] [16] [17]. Finance costs, by contrast, barely moved — Rp272bn (FY2023) to Rp294bn (FY2024) — so operating gains fell through to pre-tax profit rather than being eaten by interest [18].
The minority-interest leak: consolidated ratios understate owner returns
A reader screening ASSA on reported group ratios would see something misleading. The company's own FY2023 disclosure put net margin at 0.4% and return on equity at 0.7% — figures that use total group profit of just Rp19.4bn [19]. But that total was depressed by Rp84.3bn of losses that belonged to non-controlling interests, chiefly in AnterAja; profit attributable to ASSA's own owners was Rp103.8bn [20]. On that owner basis, FY2023 return on equity was about 5.6%, not 0.7%.
The gap runs the other way once subsidiaries turn profitable. In 9M2025, non-controlling interests took Rp140.0bn of the Rp488.6bn total profit — 29% of the group figure — so the headline group number now overstates what reaches ASSA shareholders [21]. Owner profit, not group totals, is the right base for this name. This deepens the point flagged in Business and Price — here the concern is that it distorts the profitability ratios a screen would rely on.
Source: profit attribution, FY2024 audited statements [22] and 9M2025 interim statements [23]. In FY2023 total profit sits below owner profit because minorities absorbed losses.
Owner earnings per share track this recovery cleanly: Rp28.68 (FY2023), Rp66.04 (FY2024), and Rp94.44 in 9M2025 versus Rp57.26 a year earlier [24] [25].
Balance sheet: growth funded by an asset-heavy, leveraged base
The recovery has not deleveraged the company. Total assets grew from Rp7.27tn (FY2022) to Rp8.38tn (9M2025), liabilities from Rp4.80tn to Rp5.23tn, and equity from Rp2.47tn to Rp3.16tn [26] [27]. Fixed assets — overwhelmingly the vehicle fleet — were Rp5.41tn at 9M2025, roughly two-thirds of the balance sheet [28].
Sources: FY2022–FY2023 investor deck [29]; FY2024 audited statements [30]; 9M2025 interim statements [31].
Interest-bearing borrowings — mostly bank loans — were about Rp4.10tn at 9M2025 (current maturities Rp1.12tn plus long-term Rp2.98tn), against Rp1.07tn of cash [32]. The engine of this balance sheet is fleet capex: FY2024 spending on vehicles and other fixed assets ran to roughly Rp1.5tn — Rp1.11tn of leased-vehicle purchases (run through operating cash flow) plus Rp0.42tn of other fixed-asset additions — funded partly by Rp0.86tn of used-vehicle disposal proceeds [33]. Whether that capital intensity leaves enough free cash, and whether the Rp4.1tn debt is a solvency concern, is the balance-sheet question the recovery raises but does not settle — the next chapter's territory.
Forward estimates: mid-teens EPS growth, with a seasonality caveat
Analyst consensus (3–4 covering analysts, a Strong Buy skew) has FY2025 revenue at about Rp5.99tn with EPS of Rp113.18, and FY2026 revenue of Rp6.55tn (+9.3%) with EPS of Rp132.14 (+16.7%); the mean 12-month target is Rp1,335 [34]. The FY2025 estimate is now effectively confirmed: the audited FY2025 result showed group net profit up 81% year-on-year, led by logistics [35].
FY2026E Revenue (Rp bn)
FY2026E EPS (Rp)
Mean 12-mo Target (Rp)
Source: analyst consensus estimates and price target [36].
One caveat matters for anyone tempted to annualise the strong nine-month run. Q4 is ASSA's weakest quarter. In FY2024, owner profit was Rp243.7bn for the full year against Rp212.7bn in the first nine months — implying a fourth quarter of only about Rp31bn [37] [38]. Consensus FY2025 EPS of Rp113 sits below a naive annualisation of the Rp94.44 nine-month figure precisely because it prices in that soft fourth quarter — a reason the estimate is more credible, not less.
The dividend record fits the earnings pattern: a Rp30-per-share payout on FY2024 (Rp110.7bn) and Rp50 per share on FY2025 (Rp184.6bn, 44% of net profit), a consistent low-to-mid-40s payout ratio that leaves most cash inside the fleet-funding machine [39].
What this establishes, and what would change the read
Three years of statements support a specific claim: ASSA's profit recovery is genuine and margin-led, and it now has revenue growth behind it too. Owner EPS more than tripled from FY2023 to a 9M2025 run-rate, on rising gross and operating margins rather than accounting one-offs. The evidence that most cuts against reading this as pure quality: the growth is funded by an asset-heavy, roughly Rp4.1tn-levered balance sheet with about Rp1.5tn of annual fleet capex, and roughly 29% of group profit now leaks to minorities. The read would change if margin expansion stalls, if the express unit slides back into losses, or if fleet capex stops converting into free cash — questions the balance-sheet and cash-conversion work takes up next.
Segment Economics
ASSA is one listed company wrapped around three businesses whose economics point in opposite directions, and the ownership does not sit where the returns do. ASSA fully owns the rental fleet that carries ~96% of the group's ~Rp4.2tn, 100%-floating debt yet barely breaks even pre-tax after allocated interest, while only part-owning the logistics and used-vehicle engines that earn the profit — and each 100bps of Bank Indonesia's 2026 tightening removes about Rp50.6bn of pre-tax profit (~12% of FY2024 PBT) from that near-breakeven core.
The audited segment note shows the group's operating-profit recovery — from Rp326bn (FY2023) to Rp705bn (FY2024) — is almost entirely a logistics turnaround: the AnterAja segment swung from a Rp148bn operating loss to a Rp216bn profit, about 96% of the improvement, while the asset-heavy rental core's operating profit fell. That core holds roughly 96% of the group's fixed assets and bank debt yet, after its own interest bill, earns close to nothing.
The offsets belong in the same frame: the segment interest split below is illustrative — the filing allocates finance charges only at group level — the wholly-owned fleet is a recycling machine sold at a gain, so the net cash sunk into it is small and shrinking, and net debt is falling with interest coverage rising into that tightening (Debt and Solvency).
Three pillars, three sets of economics
ASSA's revenue splits across four reported segments that map to its three pillars: corporate vehicle rental (lease, drivers, autopool, share-cars); logistics (AnterAja last-mile plus CargoShare B2B transport); and a used-vehicle ecosystem of used-car sales and vehicle auctions, run through separately-listed Autopedia (ASLC). By external revenue the group is now split almost evenly between mobility, logistics and the used-vehicle business.
Source: FY2024 audited consolidated financial statements, Note 34 Segment Information [1]; FY2023 comparatives [2].
Rental revenue is the most stable line — Rp1,849bn (FY2023) to Rp1,903bn (FY2024) [3] — reflecting multi-year corporate contracts. Logistics is now the largest external-revenue segment at Rp1,921bn [4]. The AnterAja express boom-and-bust already covered how that top line whipsawed; what the segment note adds is the profit picture behind it.
The recovery is a logistics turnaround, not a broad margin lift
The group's headline story is margin expansion. At segment level, that expansion is concentrated in one business. Between FY2023 and FY2024 logistics operating profit moved from minus Rp148bn to plus Rp216bn — a Rp365bn swing that accounts for 96% of the Rp379bn rise in group operating profit [5]. Over the same year the rental core's operating profit declined, from Rp333bn to Rp278bn [6].
Source: FY2024 audited financial statements, Note 34 [7]; FY2023 comparatives [8].
The 2025 interims extend the pattern. For the nine months to September 2025, logistics operating profit reached Rp365bn — now the single largest segment, ahead of rental's Rp247bn — while used-vehicle sales (Rp144bn) and auction (Rp61bn) held their contribution [9]. The used-vehicle ecosystem (sales plus auction) is the group's second profit source: combined operating profit of roughly Rp205bn over nine months, on almost no fixed assets. So the earnings that re-rate the stock come from two asset-light businesses — a logistics recovery and the used-vehicle ecosystem — not from the rental fleet that defines ASSA's identity.
The FY2023–FY2024 operating-profit improvement is 96% a logistics-segment swing from loss to profit. Group "margin expansion" is real, but it is one segment turning, not the whole business re-rating.
The capital and the debt sit where the returns don't
The rental core carries essentially the entire balance sheet: at September 2025 it held Rp5,176bn of the group's Rp5,407bn allocated fixed assets (95.7%) and Rp4,043bn of its Rp4,198bn bank debt (96.3%) [10]. Logistics runs on Rp61bn of fixed assets and Rp155bn of debt; the used-vehicle and auction businesses on inventory, not fleet. The profit and the capital live in different places.
Source: 9M2025 segment note, Note 34 [11]; ownership from Note 1 subsidiary list [12]. Auction ownership is ASSA's ~71.5% effective interest in JBA (92.2% held through 77.6%-owned Autopedia). 9M2025 figures are nine months.
On its own asset base the rental business earns a low return: operating profit of Rp278bn on Rp5,029bn of fixed assets in FY2024 is a 5.5% operating return; the 9M2025 run-rate is about 6.4% annualised [13]. That is the economics of a financed-fleet operator — the return is a spread over funding cost, not a high margin — and it is exactly why the balance sheet is heavy.
The rental core barely covers its own interest
The segment note reports finance charges only at group level — Rp294bn in FY2024, Rp221bn over 9M2025 [14]. Because 96% of the bank debt sits in rental, an interest bill allocated in proportion to segment borrowings lands almost entirely on that segment. On that illustrative split, rental's FY2024 operating profit of Rp278bn is fully consumed by roughly Rp281bn of allocated interest — essentially breakeven before tax — and over 9M2025 the segment clears its allocated interest by only about Rp34bn [15].
Rental share of bank debt
Rental share of fixed assets
Rental op profit after allocated interest, 9M2025 (Rp bn)
Logistics op profit, 9M2025 (Rp bn)
Source: 9M2025 segment note [16]; interest allocation derived from segment bank-debt shares (illustrative — the filing does not allocate finance charges by segment).
The allocation is a modelling convention, not a reported number, and it can be read more kindly: rental interest also funds vehicles that back the secured, laddered debt, the fleet is resellable collateral, and rental operating profit appears to be recovering in 2025 (the 9M run-rate annualises above the FY2024 level). But even on the generous reading, the wholly-owned rental core is a low-return, capital-absorbing business whose contribution to group pre-tax profit is small. The group's pre-tax earnings are generated by the asset-light segments.
That thin margin is also where a rate reversal bites hardest. Every rupiah of the debt is floating, and ASSA's own disclosure puts a 1-percentage-point move at about Rp50.6bn of pre-tax profit [17]; because 96% of the borrowings sit in rental, that swing lands almost entirely on the segment that already barely clears its interest. The covenant headroom and falling net debt that cushion it are real, but the direction of 2026 rates decides how much of the recovery the core keeps.
The profit engines are only partly owned
The final turn is who owns those engines. ASSA consolidates 100% of each subsidiary's revenue and profit, but its economic stakes differ sharply by segment [18]:
- The rental core (parent plus driver-services arm DMS, 99.8%) is effectively wholly owned.
- Logistics runs through PT Tri Adi Bersama (AnterAja), which ASSA owns just 49.5% — under half — yet consolidates in full [19]. More than half of AnterAja's newly-earned profit belongs to minority co-owners.
- The used-vehicle ecosystem sits under listed subsidiary Autopedia (ASLC, 77.6% owned); the JBA auction house is 92.2% held through Autopedia, an effective ~71.5% ASSA interest [20].
So the businesses generating the profit are the ones ASSA shares with others, while the segment it owns outright is the low-return debt carrier. That is the structural reason minority interests took 29% (Rp140bn) of 9M2025 group profit, the point raised in Financials and Estimates: it is not a rounding artifact but the geography of the group. Applying each segment's ownership to its operating profit, roughly Rp180bn of the Rp365bn logistics result and a slice of the used-vehicle profit accrue outside ASSA's shareholders — so owner-attributable operating profit is materially below the consolidated line the headline P/E is built on.
What would change the read
The bearish reading is that the earnings powering a cheap headline multiple are concentrated in a logistics turnaround of unproven durability and are partly owned by others, while the wholly-owned core barely earns its cost of debt. The bullish counter is equally on the page: the logistics recovery has now held across a full year plus three quarters rather than a single period; the used-vehicle ecosystem is genuinely profitable, asset-light and 77.6% owned; and the rental core's low accounting return partly reflects a financed-fleet model whose interest bill should ease as Bank Indonesia rate cuts flow through the 100%-floating book.
Two lines would decide it, both checkable in future segment notes: logistics operating profit sustaining above roughly Rp400bn a year through a full cycle rather than fading as express-delivery competition intensifies; and rental-segment operating profit inflecting clearly above its allocated interest cost as funding rates fall. Until then, a sum-of-the-parts view — high-return, partly-owned asset-light engines set against a large, wholly-owned, low-return financed fleet — describes the economics more faithfully than a single group multiple.
Debt and Solvency
ASSA carries roughly Rp4.2tn of bank and financing debt against about Rp2.8tn of equity — the first thing a value investor most wary of leverage would look at. The record says the load is structured conservatively: secured on a fleet it can resell, spread across a dozen banks, laddered so only about Rp1.1tn falls due within a year, and running well inside every covenant (parent DER 1.66x against a 5x limit; interest covered ~7x). Net debt has fallen, not risen, over the past year. The genuine risks are refinancing dependence and 100%-floating rates — not imminent insolvency.
What the balance sheet owes
At 30 September 2025 ASSA owed about Rp4.20tn of interest-bearing debt — almost entirely bank loans, plus a token Rp4bn of financing leases [1]. Against Rp1.07tn of cash and equivalents [2], that leaves net debt of about Rp3.13tn. The audited FY2024 book shows the same shape a quarter earlier: Rp4.02tn gross, Rp593bn cash, Rp3.43tn net [3].
The important detail is the direction of travel. Gross debt has climbed steadily as ASSA funds a growing fleet, but net debt peaked in FY2024 and has since come back down as cash nearly doubled. The leverage is growing with the asset base, not outrunning it.
Net Debt, 9M2025 (Rp bn)
Gross Debt, 9M2025 (Rp bn)
Cash, 9M2025 (Rp bn)
Source: 9M2025 balance sheet [4] [5]; FY2024 and FY2023 from the audited FY2024 book [6].
Source: derived from the FY2024 audited book and 9M2025 interim balance sheet [7] [8].
The maturity ladder
A leveraged company fails when it cannot roll or repay debt as it comes due, so the maturity profile matters more than the headline. ASSA's is laddered. At end-2024, of the Rp4.01tn of bank loans, about Rp1.13tn fell due within a year, Rp0.91tn in one-to-two years, and Rp1.97tn beyond two years [9]. No single year carries a cliff.
Source: FY2024 Annual Financial Statements, Note 36 liquidity-risk maturity table [10].
The near-term wall is larger than the cash balance was at end-2024 (Rp1.13tn due against Rp593bn of cash), which means ASSA cannot simply repay the next twelve months from cash on hand. It doesn't try to. The model is continuous refinancing: in FY2024 it drew Rp1.36tn of new long-term loans while repaying Rp1.05tn, and raised Rp425bn of short-term facilities [11]. By 30 September 2025 the picture had tightened favourably — Rp1.07tn of cash against Rp1.12tn of current bank maturities — so near-term obligations are now almost fully covered by cash before any new drawdown [12] [13]. The dependence on bank appetite remains the structural exposure: in a domestic credit freeze, the rollover — not the interest bill — is where the pressure would land.
What secures the debt, and what it costs
The debt is asset-backed. Every bank facility is collateralised by fiduciary guarantee over the specific vehicles it financed — for example, Rp1.23tn of vehicles pledged to Bank Mandiri and Rp1.09tn to BNI at end-2024, alongside land parcels pledged to BCA [14] [15]. That collateral is unusually liquid for secured debt: ASSA sells used vehicles continuously, generating Rp864bn of disposal proceeds in FY2024 alone [16]. The borrowing is spread across roughly a dozen lenders — Mandiri, BNI, BCA, BSI, CIMB Niaga, SMBC, CTBC, Bank of China, Mestika and others — so there is no single creditor whose withdrawal would be decisive [17].
The cost, and the exposure, is the rate. Facilities bore 6.58% to 9.00% in FY2024 [18], and every rupiah of it is floating — the company reports its entire Rp4.01tn book as floating-rate [19]. ASSA quantifies the sensitivity itself: a 1-percentage-point move in rates would swing pre-tax profit by about Rp50.6bn [20] — roughly 12% of FY2024 pre-tax profit of Rp429.6bn [21]. That cuts both ways: Indonesian rate cuts through 2025 held ASSA's 9M2025 finance charges essentially flat (Rp221.0bn) against Rp219.3bn a year earlier, even as the debt grew [22]. The earnings recovery is most sensitive to a sharp reversal in rates.
Covenants and headroom
The covenants are where solvency risk becomes concrete, and this is where the record is most reassuring. Most of ASSA's facilities require the parent to hold a debt-to-equity ratio no higher than 5x and interest-service coverage of at least 2x [23]. Against those limits, the company sits with room to spare and moving the right way: DER has eased from 1.82x (FY2023) to 1.78x (FY2024) to 1.66x (9M2025), while interest coverage has risen from 4.57x to 5.64x to 6.98x [24] [25]. ASSA states it complied with all covenants at each date [26] [27].
Source: parent-company covenant ratios, FY2024 book Note 21 [28] and 9M2025 Note 21 [29].
The one place a covenant did bite is the counter-fact that a bankruptcy-averse reader should weigh. The logistics subsidiary PT Tri Adi Bersama (TAB, which houses AnterAja) borrows separately from Danamon under tighter terms — net debt to operating EBITDA no more than 3.25x, plus debt-service and working-capital tests [30]. At end-2023 — the depth of the AnterAja loss trough — TAB breached the net-debt and working-capital covenants and had to obtain a formal waiver from Danamon, dated 28 December 2023 [31]. That is a real event, not a hypothetical: covenants at ASSA can and did trip when a subsidiary lost money. What matters for today's read is that it has fully reversed — by 9M2025 TAB carried essentially no net debt (net debt to operating EBITDA of roughly negative 0.7x, a net-cash position) and was back in compliance [32]. The breach maps precisely to the logistics segment's turnaround: the risk was concentrated in the unit that was losing money, and it eased as that unit recovered.
Bankruptcy risk, tested
For a reader whose first requirement is a near-zero chance of insolvency, the debt clears that bar today, with two named vulnerabilities rather than a solvency crisis.
The coverage math is comfortable. FY2024 operating profit of Rp705bn covered finance charges of Rp294bn 2.4 times [33]; adding back the roughly Rp799bn of fixed-asset depreciation that a fleet business runs through its cost line [34] lifts EBITDA to about Rp1.5tn and interest cover past 5x. On that EBITDA, net debt of Rp3.4tn (FY2024) is about 2.2 to 2.3 times — moderate for an asset-backed leasing business, and it improves to nearer 2x on the lower 9M2025 net debt. By 9M2025 operating profit of Rp814bn covered a flat Rp221bn interest bill 3.7 times [35].
Net Debt / EBITDA (x)
Interest Coverage, 9M2025 (x)
DER, 9M2025 — limit 5.0x
Source: coverage and leverage derived from the FY2024 income statement and Note 12 [36] [37]; covenant ratios per Note 21 (9M2025) [38].
The read: this is a heavy but well-structured balance sheet, not a fragile one. The debt is secured on resellable assets, laddered, spread across many banks, comfortably inside its covenants, and getting less stretched — the opposite of the profile that ends in default. The two things that could change that read are specific and watchable. First, refinancing access: because near-term maturities exceed operating cash flow after fleet reinvestment, a genuine freeze in Indonesian bank credit would strain the rollover — so the line to watch is whether cash keeps covering current maturities as it did at 9M2025. Second, a sharp rise in rates: with the entire book floating, each point costs about Rp50bn of pre-tax profit, and a large move would compress the coverage that currently looks safe. Neither is a solvency event at today's numbers; both are reasons the leverage is a live variable in the investment case rather than a settled one.
Cash Conversion
ASSA reports cash flow by the direct method, and two features make the headline figures easy to misread: fleet capital spending and used-vehicle recoveries both run through operating cash flow, while interest sits in financing. Netting them out reframes the dividend. The ~7.9% dividend that props up ASSA's 'margin of safety at ~1.07x book' was covered only ~27% by FY2024 owner free cash flow (~Rp41bn against a Rp149.6bn dividend), the rest funded by fresh borrowing and a cash drawdown — a fleet-cycle lever, not a coupon. The counter sits in the same records: the FY2024 shortfall coincided with fleet growth and Rp152.2bn of discretionary capital committed to associates, both pausable; the used vehicles that recover fleet cash sell at a gain; and in the very next period, the first nine months of 2025, owner free cash flow of about Rp379bn covered the Rp116.4bn dividend nearly three times over.
This is the cash-side test of the record earnings — whether the accounting profit is cash that services the debt and funds a real dividend.
The fleet treadmill runs through operating cash flow
Most companies show capital spending in investing activities, so operating cash flow is struck before capex and reads as a clean measure of the cash a business throws off. ASSA does not. It buys its rental fleet as "leased vehicles," and both the purchases and the proceeds from selling retired vehicles are booked inside operating activities. In FY2024 that meant Rp1,110.5bn spent on new leased vehicles and Rp864.0bn received from selling used ones, netted straight into the Rp748.3bn of operating cash flow [1].
The two lines are the two sides of one machine. Retired rental vehicles are transferred into used-vehicle inventory at their carrying amount and then sold — the accounting policy states used-vehicle inventory "includes the carrying amount of the leased vehicles from fixed assets that are transferred to used vehicles inventories" [2]. So operating cash flow already carries the cost of keeping the fleet on the road. What it does not carry is interest: ASSA parks finance charges paid — Rp282.3bn in FY2024 — in financing activities, not operating [3].
The result: neither a naive "operating cash flow" nor a naive "operating cash flow less investing capex" is what an owner keeps. Operating cash flow is already after the fleet but before the Rp282.3bn interest bill on the Rp4.2tn of borrowings that funds that fleet (Debt and Solvency).
The last two columns are nine-month figures, not full years. Source: FY2024 audited statements [4] and 9M2025 statements [5].
Read the two bars together and the net cash sunk into the fleet is small, and shrinking: Rp371.7bn in FY2023, Rp246.5bn in FY2024, and in the nine months to September 2025 the sign flipped — Rp800.9bn of used-vehicle proceeds slightly exceeded Rp752.0bn of purchases [6]. How much cash the model consumes is most sensitive to whether ASSA is growing the fleet or harvesting it.
What the cash actually converts to
To see what owners keep, start from operating cash flow, subtract the interest the fleet debt costs, and subtract the capital spending that does not run through operating — the "purchase of fixed assets and advances" line and intangibles, which cover autopool facilities, logistics infrastructure, IT and non-fleet equipment. That defines a cleaner owner free cash flow. It excludes financial investments (fresh capital into associates, securities), which are discretionary, and dividends, which are a distribution rather than a cost of running the business.
Owner FCF is derived: operating cash flow less finance charges paid less net fixed-asset and intangible capex. The last two columns are nine-month figures. Source: FY2024 audited statements [7][8]; 9M2025 statements [9][10].
On a full-year basis the residual is thin. FY2024 operating cash flow of Rp748.3bn, less Rp282.3bn interest and Rp425.2bn of net non-fleet capital spending, left roughly Rp41bn of free cash for owners [11]. Against that, the company paid Rp149.6bn of dividends and committed a further Rp152.2bn of fresh capital to associates [12]. The gap was met by the balance sheet: net new borrowing of about Rp99bn and a Rp167.1bn drawdown of the cash pile, which fell from Rp760.2bn to Rp593.1bn over the year [13].
The FY2024 reconciliation, in one place:
Source: FY2024 audited Consolidated Statement of Cash Flows [14][15].
FY2023 tells the same story in smaller numbers: operating cash flow of Rp481.7bn, less Rp259.2bn interest and Rp208.7bn net non-fleet capex, left about Rp14bn of owner free cash flow, and the cash balance fell Rp172.0bn that year too [16]. Across both full years in the record, the dividend was not covered by internally generated cash — it was topped up from the balance sheet while the business invested.
The 2025 pivot to harvest
The first nine months of 2025 look different, and the difference is deliberate. ASSA cut leased-vehicle purchases to Rp752.0bn from Rp824.0bn a year earlier, while used-vehicle proceeds rose to Rp800.9bn, so the fleet turned cash-generative rather than cash-absorbing [17]. Operating cash flow rose to Rp811.2bn, and after Rp217.3bn of interest and Rp214.8bn of non-fleet capex, owner free cash flow was about Rp379bn — comfortably ahead of the Rp116.4bn dividend, with roughly Rp263bn to spare [18][19].
9M2025 Operating Cash Flow (Rp bn)
9M2025 Owner FCF (Rp bn)
9M2025 Dividends Paid (Rp bn)
Cash at 30 Sep 2025 (Rp bn)
BigValues show the 9M2025 (nine-month) figures. Owner FCF is derived. Source: 9M2025 Consolidated Statement of Cash Flows [20][21].
The cash balance climbed Rp477.4bn over the nine months, from Rp593.1bn to Rp1,070.5bn — the highest in the record [22]. Some of that build was borrowed — the group still drew about Rp213bn of net new debt over the period — but even setting the new borrowing aside, operating cash after interest, capex and the dividend was strongly positive [23]. When ASSA stops growing the fleet, the model converts.
The seasonality caveat, and what it means for the dividend
The 2025 harvest cannot simply be annualised, because ASSA's capital spending is back-end loaded. In FY2024, nine-month owner free cash flow was Rp418.9bn, yet the full year came in at Rp40.8bn — the fourth quarter alone consumed roughly Rp378bn of cash [24]. Most of that swing was a Rp358bn step-up in non-fleet fixed-asset spending that landed in the fourth quarter [25]. This compounds the weak-Q4 earnings pattern established earlier (Financials and Estimates): the fourth quarter is soft on profit and heavy on capex, so a nine-month cash figure flatters the full year on both counts.
My read: ASSA's cash conversion is real but structurally thin and cyclical with the fleet cycle. The dividend is covered by internal cash only when the company is in harvest mode — throttling fleet growth and monetising retirements, as in 2025 — and is topped up from the balance sheet when it invests, as in FY2023 and FY2024. That bears on the yield-as-margin-of-safety case: the payout is sustainable, but as a function of management's fleet-investment discipline, not a fixed coupon on the business.
The strongest fact on the other side is that the balance sheet can carry the difference cheaply, and the fleet cash-out is not a sunk cost. Used-vehicle sales run at a gain to carrying value, so the disposals that recover fleet cash are profitable, not distressed, and reported fixed assets sit below realisable value — which is also why book value is a floor rather than a ceiling in the sum-of-the-parts. What would change the read is evidence of sustained full-year owner free cash flow comfortably above the dividend through a fleet-growth year — not just during a harvest window. The audited FY2025 statements, once filed, are the first place to look: if the Rp1,070.5bn cash balance survives the fourth-quarter capex season, the harvest is more than a pause in spending.
What Rp635 Pays For
At Rp635 ASSA is a Rp2.34tn company. Two things its shareholders own can be marked with little argument — a 77.6% stake in separately-listed Autopedia (worth ~Rp632bn at Autopedia's own market price) and the equity in its rental fleet (~Rp1.13tn of vehicles net of the debt secured on them) — and together they cover roughly three-quarters of that market value. The remaining ~Rp0.58tn is what the market pays for a 49.5% stake in the group's largest profit segment. The safety is real, but it sits in ignored stakes, not a discount to book.
What the price implies
Price / FY2025 owner earnings
Price / owners' equity
Dividend yield
EV / FY2025 EBITDA
EV / FY2025 EBIT
Upside to consensus target
Source: market price Rp635 (17 Jul 2026) and consensus (target Rp1,335, FY2025 EBITDA ~Rp1.80tn, EBIT ~Rp1.0tn) per market data; owners' equity Rp2,193.4bn and 3,691,137,517 shares from the 9M2025 balance sheet [1]; net debt Rp3,131.5bn per Debt and Solvency.
The multiples are low on every lens a value buyer would use. At Rp635 the market capitalises FY2025 owner earnings of Rp417.7bn at 5.6 times — an 18% earnings yield — pays 1.07 times the Rp2,193.4bn of equity that belongs to ASSA's own shareholders [2], and yields ~7.9% on the Rp50 dividend. Consensus, from the three-to-four analysts who still cover it, sits at Rp1,335 — more than double the price.
One number needs a caveat before it flatters. EV/EBITDA of ~3.0x looks arresting, but this is a financed-fleet business: the ~Rp0.8tn of annual fleet depreciation is a genuine replacement cost, not a bookkeeping add-back, because the vehicles wear out and must be bought again. On EV/EBIT — which charges that cost — the multiple is ~5.3x. That is cheap, but only modestly cheaper than an already-cheap listed peer.
Source: ASSA per market price and consensus (as above); Blue Bird (BIRD) valuation and yield per market data (mid-2026). Blue Bird runs taxi, car-rental and logistics operations — the closest listed Indonesian comparable to ASSA's rental and delivery mix, though not a pure match.
Blue Bird, the nearest listed comparator, trades at 6.9x earnings and ~5x EBITDA on a similar transport-and-rental model. ASSA is cheaper on both, and carries a similar dividend yield. So the discount is not a mirage created by one aggressive metric — but nor is it the kind of gap that a peer re-rating alone closes. The sharper argument sits below the multiples, in the parts.
Sum of the parts
ASSA is easier to value in pieces than as a whole, because two of its pieces carry outside marks. Its used-vehicle and auction ecosystem is held through Autopedia (ASLC), a separately listed company; at Autopedia's own 17 July price its equity is worth ~Rp814bn, and ASSA owns 77.6% of it — a market-tested ~Rp632bn [3]. Its rental fleet is carried at Rp5,175.9bn of vehicles at net book value, against Rp4,042.6bn of bank debt secured on those same vehicles — ~Rp1,133bn of net equity in resellable metal [4]. The fleet mark is if anything conservative: ASSA sells used vehicles at a gain to book, and disposal proceeds run to roughly Rp0.86tn a year.
Source: Autopedia (ASLC) market capitalisation Rp813.8bn at 17 Jul 2026 (market data) x 77.6% ownership [5]; rental fixed assets Rp5,175.9bn less rental bank debt Rp4,042.6bn from Note 34 [6]; residual = Rp2,343.9bn market cap less the two marks.
Those two marks add to ~Rp1.76tn — about 75% of the Rp2.34tn market value. Group cash of Rp1,070.5bn [7] roughly offsets the Rp1,029.8bn of unallocated non-debt liabilities (deferred tax, employee benefits, payables) it is set against [8], so leaving both out of the bridge is fair rather than convenient. What remains — the ~Rp0.58tn the market pays beyond Autopedia and the fleet — is essentially the price on ASSA's 49.5% of AnterAja and its rental earnings power.
The engine the market barely pays for
AnterAja, the logistics business held through PT Tri Adi Bersama (TAB, 49.5%-owned but fully consolidated), booked Rp365.2bn of operating profit in nine months — the group's single largest segment, ahead of the rental core's Rp247.2bn — on an asset-light base of just Rp60.9bn of fixed assets and Rp155.0bn of debt [9], against Rp868.4bn of total assets [10]. Annualised, that is roughly Rp490bn of operating profit from a near-net-cash business — the turnaround detailed in Segment Economics.
The ~Rp0.58tn residual values ASSA's entire 49.5% share of that engine — plus the auction business and any rental value above net book — at about 1.2 times AnterAja's annualised operating profit, or roughly 2.4x on a whole-company look-through. For a growing, profitable, asset-light logistics operator that is a distress price, and it is being applied to the part of ASSA that is actually driving the earnings recovery.
Source: derived from the segment and ownership disclosures cited above [11] [12] and Autopedia's listed price (market data); the logistics multiple is the illustrative assumption the range is most sensitive to.
The table shows where the leverage in the valuation lives. The Autopedia mark is fixed by the market. The fleet mark barely moves — it is book value on resellable assets. The whole range is driven by what one pays for AnterAja: at 4x annualised operating profit the parts roughly equal today's price; at 6x they sit ~45% above it. The valuation is most sensitive to whether AnterAja's profit holds, the falsifiable line flagged in Segment Economics.
How much pessimism is priced in
The clearest evidence that expectations are low is what the price did when the news was good. ASSA reported FY2025 group profit up 81% and raised its dividend; over the following months the shares fell from ~Rp1,190 to ~Rp635.
Source: month-end closing prices, Jan–Jul 2026 (market data); FY2025 result confirmed by the audited filing and consensus.
At Rp635 the stock is ~47% below where it started 2026 and ~84% below its 2021 peak, even though owner earnings roughly quadrupled over that span (Rp104bn in FY2023 to Rp418bn in FY2025). An 18% earnings yield on a business that grew profit that fast is the market pricing the recovery to stall or reverse.
That pessimism is not baseless, and a value buyer should hold the counter-case in view:
The discount has identifiable reasons. Roughly 29% of group profit accrues to minority interests, so the consolidated asset base is not all ASSA's to keep. The rental core carries ~96% of the group's assets and debt yet earns only a mid-single-digit return on those assets and barely covers its allocated interest — most of the "book" is low-returning financed metal. The profit recovery leans heavily on a single segment (AnterAja) whose durability is unproven. And with three-to-four analysts and a small free float, the stock can de-rate on liquidity alone.
Each of those is developed elsewhere — the minority leak and the low-return core in Segment Economics, the earnings quality in Financials and Estimates. The point here is that the market has already discounted them heavily, and arguably more than heavily.
The margin-of-safety read
The evidence points to a genuine but specific margin of safety. It is not the deep-below-net-asset-value bargain the phrase usually implies: at 1.07x owners' equity, ASSA trades at roughly book, not beneath it. The safety comes instead from three things that bound the downside. An observable listed stake (Autopedia) fixes ~Rp632bn of the value at a market price. The rental fleet is resellable collateral sold at a gain to book, and — as Debt and Solvency established — the debt behind it is laddered, covenant-compliant and carries low near-term bankruptcy risk, which matters directly to an investor who wants that risk near zero. And a ~7.9% dividend pays the holder to wait — with one qualification. The ~7.9% dividend that props up ASSA's 'margin of safety at ~1.07x book' was covered only ~27% by FY2024 owner free cash flow (~Rp41bn against a Rp149.6bn dividend), the rest funded by fresh borrowing and a cash drawdown — a fleet-cycle lever, not a coupon. The FY2024 shortfall coincided with fleet growth and pausable associate capital, and 9M2025 owner free cash flow of ~Rp379bn covered the payout nearly threefold, as Cash Conversion sets out. On top of that floor, the market is ascribing a distress multiple to the one segment actually generating the profit growth.
The strongest fact against the read is that the cheapness rests on the low-return rental core being most of the company: if AnterAja's logistics profit fades and the fleet keeps earning ~6% on assets, the parts are worth roughly today's price and no more — the residual, not a hidden surplus. What would change the read in the bull's favour is concrete and watchable: AnterAja operating profit sustaining above ~Rp400bn a year, or the rental core's return on assets rising as Bank Indonesia rate cuts flow through its entirely floating-rate debt. Either would turn the ~Rp0.58tn the market pays for the engine into an evident understatement.
Ownership and Pay
ASSA is genuinely founder-run and family-controlled. Insiders and affiliated corporate holders own roughly 53% of the shares; founder and President Director Prodjo Sunarjanto holds 9.3% (about Rp218bn at the current price) and edged his stake up during the share-price collapse. Board pay is modest and entirely cash — Rp37.3bn in FY2024, about 15% of owner profit, with no stock or option awards — and related-party dealings are immaterial and shrinking. The offset: minorities sit beneath a control block, and board independence is confined to two of four commissioners.
For a reader drawn to beaten-down founder-run businesses, this chapter checks the "aligned owner-operator" label against the filings, where it largely holds up.
Who owns ASSA
The register at 30 September 2025 shows a concentrated but conventional Indonesian control structure: two corporate holders above the 5% disclosure line, a cluster of directors and commissioners holding shares personally, and a public float of 46.6%.
Source: FY2025 nine-month consolidated financial statements, Note 22 Share Capital and Non-controlling Interest — shareholder register at 30 September 2025 [1].
The two corporate blocks anchor the structure. PT Adi Dinamika Investindo (23.08%) is the Triputra Group holding vehicle through which T.P. Rachmat's conglomerate controls ASSA; the company presents itself as "part of Triputra Group," alongside PT Daya Adicipta Mustika (17.65%), a holder within the same Astra-Honda / Daya family of businesses [2]. That the Daya companies are affiliates rather than arm's-length outsiders is corroborated by the related-party note, which classifies PT Daya Adicipta Wihaya, PT Daya Adicipta Sandika and PT Daya Anugerah Mandiri as entities "under common control" [3].
Added to the personal holdings of the directors and commissioners, the aligned block comes to roughly 53% of the company — a working majority — leaving a 46.6% public float. IFC, the World Bank's private-sector arm, became a shareholder (about 2.6%) in July 2023 when its convertible bond converted into equity; it now sits inside the public bucket [4].
Insiders + Affiliates
Founder-CEO Stake
Public Float
Source: derived from the 30 September 2025 shareholder register (percentages sum of named insiders and affiliated corporate holders) [5]. All three figures shown as percentages.
Skin in the game
Prodjo Sunarjanto is not a hired manager with a token holding. He is the founding shareholder and has run ASSA as President Director for around fifteen years, after a career at Astra International [6], [7]. His 342.6m shares — 9.28% of the company — are worth about Rp218bn at the recent Rp635 price, a personal stake many multiples of his annual pay [8].
The direction of travel matters as much as the level. Comparing the two registers in the same note, Prodjo's holding rose from 341,938,300 shares at 31 December 2024 to 342,568,300 at 30 September 2025 — a modest 630,000-share addition, but an addition, made while the stock was falling rather than a sale into it [9]. No director in the register reduced a holding over the period.
One movement cuts the other way and deserves to be named. T. Permadi Rachmat — the Triputra patriarch — held 188.8m shares (5.12%) personally at 31 December 2024, enough to clear the 5% line; by 30 September 2025 that personal block no longer appears above the threshold, and the public float rose by almost exactly the same amount (41.66% to 46.61%) [10]. The register does not say whether he sold or simply moved shares below the disclosure line, and the Triputra corporate holding (23.08%) was unchanged — so group control is intact — but a founder-family member's personal stake shrinking during the sell-off is the honest counterweight to the founder-CEO's small buy.
What management is paid
The alignment here comes from ownership, not from the pay package — because the pay package contains no equity at all. Total remuneration to the Boards of Directors and Commissioners was Rp37.3bn in FY2024 (Rp35.5bn to the four directors, Rp1.7bn to the commissioners), every rupiah of it classified as short-term employee benefits: no bonus, no stock awards, no options disclosed [11].
Source: FY2024 consolidated financial statements, key-management remuneration note (FY2023 comparatives shown) [12]. Owner-profit ratio derived from reported net profit attributable to owners.
Two features stand out. First, pay is sticky and does not chase the earnings cycle: directors' remuneration rose 4.8% year on year even as net profit attributable to owners more than doubled (Rp103.8bn to Rp243.7bn), so board pay fell from about 34% of owner profit in FY2023 to about 15% in FY2024 [13]. Second, the level is modest for the size of business — roughly Rp8.9bn per director on average across a company earning several hundred billion rupiah for its owners.
The absence of equity or bonus disclosure is double-edged. It means shareholders are not being diluted by option grants, and it means the register is the whole incentive story: what aligns Prodjo with minorities is the Rp218bn he already owns, not a package that would pay him to lift the share price. Indonesian practice also discloses board pay only in aggregate — there is no per-person, salary-versus-bonus split — so the granularity a reader might want is simply not in the filings [14].
Related-party dealings
For a conglomerate-controlled company, the test is whether the controlling family uses it as a captive supplier or customer — whether earnings quietly leak out through related-party dealings. At ASSA the answer, on the disclosed numbers, is no.
Related-Party Vehicle Purchases, FY2024 (% of revenue)
Related-Party Payables, FY2024 (% of liabilities)
Source: FY2024 consolidated financial statements, Note 7 Transactions and Balances with Related Parties [15], [16]. Both figures shown as percentages.
The largest related-party line runs the other way — ASSA buying fleet vehicles from affiliated Daya and Triputra dealerships — and it too is modest: Rp109.7bn of such purchases in FY2024, just 2.21% of revenue, and it is falling, down from Rp155.4bn (3.50%) in FY2023 [17]. The single largest counterparty, PT Daya Adicipta Wihaya, supplied 0.70%. Actual sales back to related parties are smaller still. On the balance sheet the footprint is smaller again: related-party trade payables totalled Rp7.3bn, or 0.15% of total liabilities, and receivables were similarly negligible [18], [19]. There are no large intercompany loans to the parent and no asset transfers of consequence in the note. For a family-controlled Indonesian company, that is a clean record.
The governance caveat
None of this removes the structural fact that minority holders sit beneath a control block that can outvote them. ASSA runs the standard Indonesian two-tier board: an all-executive Board of Directors and a supervisory Board of Commissioners [20]. Independence resides entirely on the supervisory side — two of the four commissioners are independent — while all four directors, and the President Commissioner (Erida, also Triputra Group's CFO), are group insiders. There is no independent voice on the executive board, and the same family that controls the votes sets the strategy.
The evidence points to an aligned, disciplined owner-operator, not an extractive one — the founder holds a Rp218bn stake and is adding to it, pay is restrained and cash-only, and value is not leaking to affiliates. The strongest fact against it is Rachmat's personal stake slipping below the disclosure line during the sell-off, and the standing reality that a ~53% aligned block leaves minorities as price-takers on any future control decision. What would change the read is a step-up in related-party dealing, a dilutive equity issue, or continued insider selling in the next register — none of which is visible today. How that alignment has translated into capital returns is taken up in Financials and Estimates.
Industry Tailwinds
The demand backdrop under ASSA is favorable but uneven, and the strength of the tailwind differs sharply by pillar. Indonesia's transportation and warehousing sector grew 8.78% in 2025 — ahead of 5.11% GDP — which supports the corporate-rental and B2B-logistics cores [1] [2]. But the loudest tailwind — e-commerce express delivery — is a price war ASSA has deliberately retreated from, and the used-vehicle digitalization vector now draws a well-funded rival. Each pillar's growth carries a matching caveat.
A supportive macro backdrop
The starting point is a domestic economy growing steadily with low inflation. Indonesia's GDP rose 5.11% in 2025, with headline inflation held at 2.92%, inside Bank Indonesia's 2.5±1% target [3]. More useful for a mobility-and-logistics group is the sector detail: transportation and warehousing expanded 8.78%, and the business-services and other-services sectors grew 9.10% and 9.93% — the segments that generate corporate demand for outsourced fleets and freight [4]. Indonesia's digital economy reached about US$99 billion in 2025, the demand pool behind last-mile parcels and online vehicle marketplaces [5].
GDP growth 2025
Transport & Warehousing
Business Services
Digital Economy ($B)
Sources: Indonesia 2025 macro data as compiled in the peer filing [6] [7]; digital-economy figure per e-Conomy SEA 2025 as cited there.
Two limits on this backdrop are worth stating plainly. First, these are sector-wide figures drawn from a peer's audited report, not an ASSA disclosure — ASSA's own annual reports are not in the accessible record, so a precise, company-specific market-size and penetration series cannot be built here. Second, a sector growing 8.78% sets the market's pace, not any one operator's share: whether ASSA grows with it depends on competition and pricing, examined pillar by pillar below.
Corporate rental: a GDP-plus current, on a contested field
The rental core is where the tailwind is most structural and most defensible. Corporate fleet outsourcing — companies renting cars with drivers rather than owning and managing them — scales with formal-sector employment and business activity, and management's own 2024 framing pointed the same way: positive top-line growth with group bottom-line growth of 5–10%, with rental positioned to grow at least in line with GDP [8]. ASSA runs one of the larger fleets in the market — roughly 30,030 vehicles at end-2023, at around 93% utilization [9].
The caveat is competitive structure, not demand. The corporate-rental field is crowded with capitalized operators: Astra's TRAC (Serasi Autoraya) is the market-leading brand with nationwide airport and branch coverage, MPM Rent runs a roughly 16,000-unit active fleet, Batavia Rent is a listed pure-play, and Blue Bird is expanding rental and shuttle alongside its taxis [10]. A GDP-plus tailwind shared among well-funded rivals is a volume tailwind, not automatically a pricing or margin one — and the segment economics elsewhere in this report show the rental core earning a thin return on its assets (Segment Economics). Demand growth here is real and durable; what remains open is share and price, not whether the sector is growing.
Express delivery: volume growth without margin
The express-delivery pillar is the clearest case of a large tailwind that does not translate into economics. Indonesia's courier, express and parcel market is genuinely growing — third-party estimates put it near US$7.9 billion in 2025 rising to about US$11.2 billion by 2030, a ~7% compound rate — carried by e-commerce.
Source: third-party market-research estimates for Indonesia's CEP market (≈7% CAGR, 2025–2030). Figures are industry estimates, not a company disclosure.
The problem is what that growth is worth. The B2C express market is a price war: J&T Express, the largest regional player, turned its first profit only in 2024 despite roughly 29% Southeast Asian share, and industry participants describe delivery fees as having reached "rock bottom." Platform capture compounds it — marketplaces such as Shopee route volume to in-house couriers and have periodically dropped third-party carriers, so parcel flow and pricing are set by the e-commerce platforms, not the couriers.
ASSA has already drawn the conclusion. Its own materials describe the early AnterAja e-commerce focus as structurally low-margin — parcels spread thinly across the archipelago, "causing higher cost and lower profitability" — and lay out a deliberate pivot toward bulk B2B logistics, where loads are combined and margins are higher [11]. The logistics turnaround that drove the group's earnings recovery (Segment Economics) came from retreating from the price-war channel, not from riding the e-commerce tailwind. It also matters who else owns the express asset: AnterAja (PT Tri Adi Bersama) is 49.5% ASSA, 22.5% GoTo, 18% SF Express and 10% Garibaldi Thohir — so the parties best placed to feed or starve it of e-commerce volume sit on its own cap table [12]. The read: the headline tailwind is real in parcels and weak in profit, and the segment's profitability now depends on B2B execution rather than on e-commerce growth.
Used vehicles: digitalization, now with a giant competitor
The used-vehicle pillar sits between the other two: a genuine digitalization tailwind, but one that has just attracted a much larger balance sheet. ASSA's JBA is described as the largest wholesale automotive auction marketplace in Indonesia, and its traction is visible — auction volumes rose from roughly 71,000 units in FY2022 to about 101,000 in FY2023, while the Caroline O2O used-car retail arm grew from 2,507 to 3,135 units over the same year [13]. Formalizing and digitizing a large, fragmented used-car market is a structural growth vector, and it is asset-light relative to the rental fleet.
The competitive caveat arrived with real money. Astra is building the same online-to-offline used-car model through Astra Digital Mobil (OLXmobbi); Toyota (via TMA) invested about US$120 million for a 40% stake, leaving Astra with 60% control [14]. A conglomerate with Astra's distribution and a global carmaker's capital entering the used-car marketplace is a direct challenge to JBA/Caroline's runway. The digitalization tailwind is real, but the field is no longer ASSA's to grow into unopposed.
The cross-cutting variable: a soft new-car market
One industry trend touches every pillar and cuts in more than one direction: new-car sales have been falling. Indonesian wholesale volumes dropped from just over one million units in 2023 to 865,723 in 2024 (−13.9%) and 803,687 in 2025 (−7.2%), per the industry association Gaikindo, on weak purchasing power and tighter credit.
Source: Association of Indonesian Automotive Manufacturers (Gaikindo) wholesale data, as reported. Industry figures, not a company disclosure.
The effect on ASSA is genuinely two-sided. Cheaper, more available new vehicles lower the cost of refreshing the rental fleet, and softer new-car demand can push buyers toward used cars — supporting JBA and Caroline volumes. Against that, a weak auto market pressures used-vehicle prices, which matters because the rental model books a gain when it sells four-year-old cars above book value [15], and persistently weak consumer demand caps how fast corporate mobility spends. This is a variable to monitor rather than a settled tailwind or headwind.
What to watch
The pillar-by-pillar picture assembles into a scorecard: strong, defensible demand under rental and B2B logistics; a loud but low-margin e-commerce tailwind ASSA has stepped back from; and a real used-vehicle digitalization vector now contested by Astra.
Source: derived from the sources cited in this chapter — peer macro data [16], ASSA disclosures [17] [18], the competitor set [19], and third-party CEP/auto-market estimates.
For an investor testing whether the demand story is real, three falsifiable lines follow. First, transportation-and-warehousing sector growth staying above GDP is the clean signal that the rental and B2B-logistics cores retain a structural pull; a convergence to or below GDP would remove it. Second, the logistics segment's operating profit sustaining its recent level would confirm that the B2B pivot, not the e-commerce tailwind, is the durable engine — one of the most sensitive forward inputs in the case, given that the logistics turnaround drove the group's recent earnings recovery, so its persistence largely determines whether that recovery holds (Segment Economics). Third, JBA auction volume growth holding up as OLXmobbi scales would show the used-vehicle vector survives a well-funded entrant. The evidence points to a demand backdrop strong enough to support the core but not strong enough to carry a leveraged, asset-heavy model on its own; what would change that read is durable margin — not volume — in the segments where the tailwinds are loudest.
What to Watch
Eight chapters resolve into one reconciliation. ASSA is a leveraged, low-return fleet owner wrapped around two partly-owned, asset-light profit engines, and the market prices it as if the larger engine were nearly free. On balance the evidence favours a mispriced fallen star over a value trap — but that read turns on three checkable lines: whether the logistics turnaround holds, what the 100%-floating debt bill does now that Bank Indonesia has reversed course, and whether record profit becomes owner cash. This chapter sets out the tension, three ways it resolves, and the line items that will settle it.
The setup, in four numbers
P/E — FY2025 owner earnings
Price / owners' equity
Dividend yield
Net debt / EBITDA
Source: derived from reported financials — 9M2025 statement of financial position [1] and FY2025 headline earnings — with market data, mid-July 2026.
At Rp635 the stock sits about 84% below its 2021 peak while owner earnings roughly quadrupled to about Rp418bn between FY2023 and FY2025. The gap between those two facts is what the report weighs, and it is neither obviously a bargain nor obviously a trap: 1.07x owners' equity of Rp2,193.4bn is roughly book, not a discount to it [2]. Whether that is cheap or fair depends less on the multiple than on the durability of the profit behind it — which the rest of this chapter tests.
The tension, in one table
Each row below is a shared fact that both a bull and a bear accept — the disagreement is over what it means, and each disagreement has an evidence test that would settle it.
Sources: segment operating profit, Note 34 [3]; covenants, Note 21 [4]; subsidiary structure, Note 1 [5]; floating-rate profile [6]; cash-flow statement [7].
The bull and bear do not actually disagree about the numbers — they disagree about which way three variables break. Two of those variables moved in 2026, and not in the direction the earlier chapters assumed.
What moved the price in 2026
The 2026 sell-off has an identifiable, largely non-fundamental component. ASSA was removed from the MSCI Small Cap indexes at the May 2026 semi-annual review, effective after the close on 29 May 2026 — index deletions of this kind mechanically force passive foreign selling regardless of results, and this one landed in a year when group profit rose 81% and the dividend was raised. That is the signature of a technical de-rating layered on a business that was improving, not deteriorating, and it supports reading the de-rating as technical rather than fundamental.
The rate environment cuts the other way, and it is the more important of the two. Earlier chapters carried an assumption that Bank Indonesia's easing would flow through the 100%-floating book and lower the interest bill — coverage was expected to widen, and the thin pre-tax contribution of the rental core to improve. That assumption has expired. Bank Indonesia cut to a 4.75% trough by September 2025, held through year-end, then reversed sharply: it raised the policy rate by a total of 100 basis points from May 2026 — to 5.25% on 20 May, 5.50% on 9 June and 5.75% on 18 June — its highest level since April 2025, to defend the rupiah. On ASSA's own disclosed sensitivity, a 1% rise in rates lowers pre-tax profit by about Rp50.6bn — roughly 12% of FY2024 pre-tax profit — so the 100bps of 2026 tightening is a live headwind on a book that reprices in full [8].
Source: Bank Indonesia policy announcements (2025–2026), author's compilation; ASSA reports 100% of its Rp4.01tn debt at floating rates.
Neither event changes the asset base, and neither is in the corpus — both are recent market and policy facts. But together they reframe the swing variables: the price overhang is partly explained (and partly technical), while the interest-cost tailwind the segment economics leaned on has become a modest headwind.
Three ways this resolves
The scenarios below triangulate a range rather than assert a target. The bear anchor is arithmetic: crediting only the two marks that need little argument — Autopedia's listed stake at market and the rental fleet at net book less its secured debt — implies about Rp478 per share, roughly 25% below the current price and the level at which an investor is paying nothing for the logistics engine. The base case re-rates the stock to a cheap listed peer's multiple. The bull case is the sum-of-the-parts working out, with the logistics engine valued as a going concern.
Source: author's scenarios, built on the sum-of-the-parts and peer multiples from Margin of Safety; segment figures, Note 34 [9]. Illustrative, not price targets.
The distribution is asymmetric in a specific way, and this is the most useful thing the report can leave a reader with. The bear anchor is not zero — it is roughly a quarter below today's price, floored by an observable listed stake, resellable fleet collateral behind covenant-compliant secured debt, and low bankruptcy risk (Debt and Solvency). The upside, by contrast, depends on a business that is already profitable simply holding its profit. That is the shape a value investor looks for: a bounded, asset-backed downside against an upside that does not require heroics. What it is not is a below-net-asset-value bargain — at roughly book, the margin of safety comes from the ignored logistics engine and the dividend, not from buying assets beneath their carrying value.
The main fact against the constructive read sits inside the same frame. ASSA fully owns the rental fleet that carries ~96% of the group's ~Rp4.2tn, 100%-floating debt yet barely breaks even pre-tax after allocated interest, while only part-owning the logistics and used-vehicle engines that earn the profit — and each 100bps of Bank Indonesia's 2026 tightening removes about Rp50.6bn of pre-tax profit (~12% of FY2024 PBT) from that near-breakeven core [10] [11] [12]. That is why a material share of the profit that makes the stock look cheap does not belong to ASSA's shareholders: non-controlling interests took 29% of group profit in 9M2025, with the profit engines — AnterAja at 49.5%, the used-vehicle ecosystem at 77.6% — the partly-owned ones. A reader who models this company on look-through economics, not headline group profit, is closer to the truth.
What to watch
Each item below is falsifiable and checkable in a named filing line, with a threshold that would move the read. Ranked by decision value.
Sources: segment information, Note 34 [13]; interest-rate sensitivity [14]; dividend paid, financing cash flows [15].
Three of these six resolve on one document — the FY2025 audited annual report, which is not yet in the corpus. When it files, the segment split will show whether logistics held, the cash-flow statement will show whether the dividend was self-funded, and the shareholder note will show whether the control block and the founder's alignment survived the sell-off intact. Until then, the constructive read rests on a business whose profit is real and whose downside is asset-backed, held against two things a bull must keep answering: that the profit belongs disproportionately to minorities, and that the interest bill on a fully-floating balance sheet is now rising rather than falling.